Immigrants from Australia vs Japanese Cognitive Disability
COMPARE
Immigrants from Australia
Japanese
Cognitive Disability
Cognitive Disability Comparison
Immigrants from Australia
Japanese
17.1%
COGNITIVE DISABILITY
76.0/ 100
METRIC RATING
157th/ 347
METRIC RANK
18.3%
COGNITIVE DISABILITY
0.0/ 100
METRIC RATING
298th/ 347
METRIC RANK
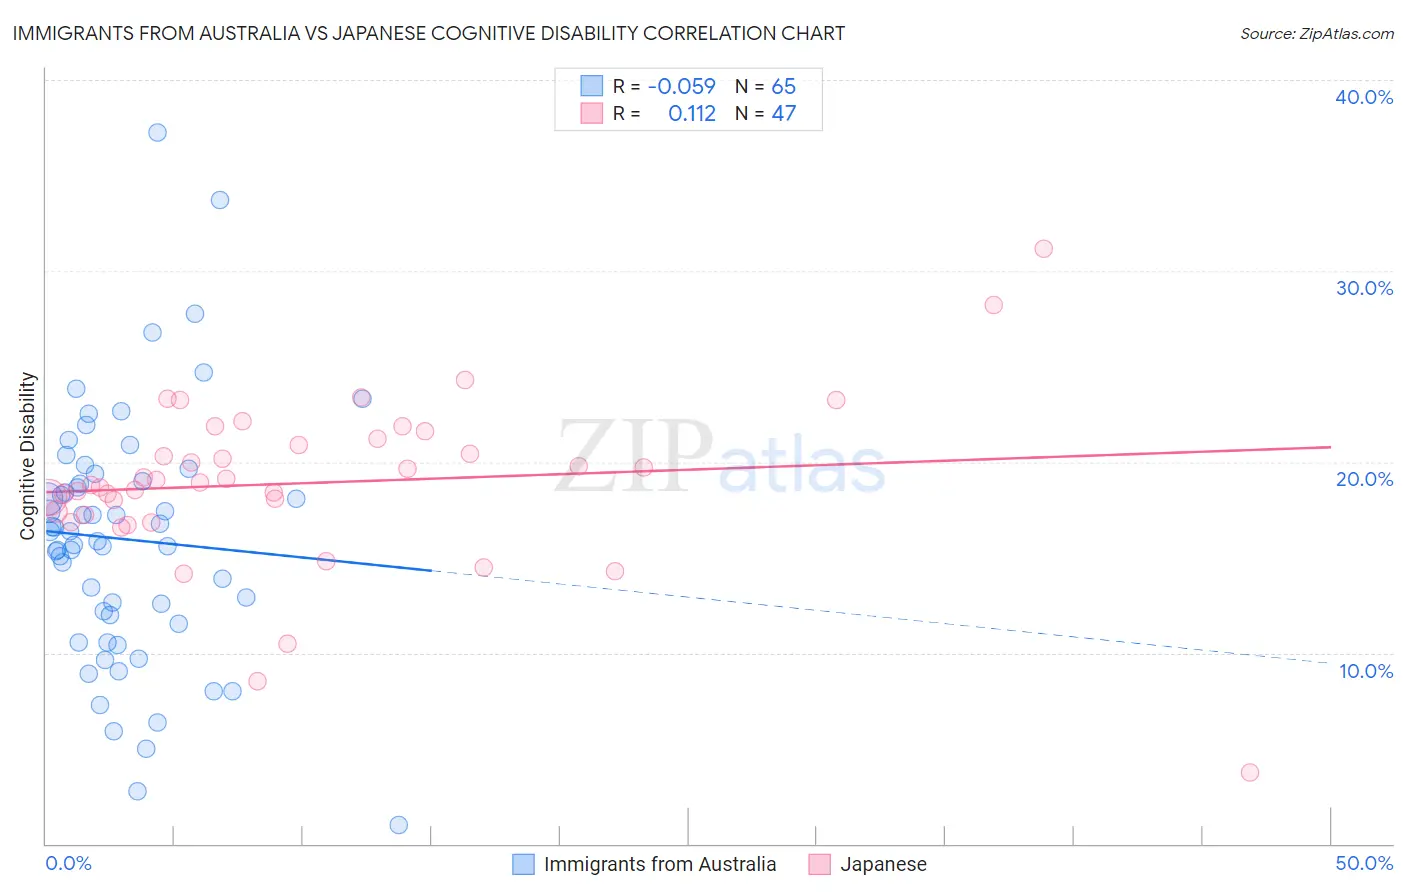
Immigrants from Australia vs Japanese Cognitive Disability Correlation Chart
The statistical analysis conducted on geographies consisting of 227,201,073 people shows a slight negative correlation between the proportion of Immigrants from Australia and percentage of population with cognitive disability in the United States with a correlation coefficient (R) of -0.059 and weighted average of 17.1%. Similarly, the statistical analysis conducted on geographies consisting of 249,155,070 people shows a poor positive correlation between the proportion of Japanese and percentage of population with cognitive disability in the United States with a correlation coefficient (R) of 0.112 and weighted average of 18.3%, a difference of 6.6%.
Cognitive Disability Correlation Summary
| Measurement | Immigrants from Australia | Japanese |
| Minimum | 0.98% | 3.7% |
| Maximum | 37.3% | 31.2% |
| Range | 36.3% | 27.4% |
| Mean | 15.9% | 18.9% |
| Median | 16.4% | 18.9% |
| Interquartile 25% (IQ1) | 11.8% | 17.2% |
| Interquartile 75% (IQ3) | 19.2% | 21.2% |
| Interquartile Range (IQR) | 7.4% | 4.0% |
| Standard Deviation (Sample) | 6.6% | 4.5% |
| Standard Deviation (Population) | 6.5% | 4.4% |
Similar Demographics by Cognitive Disability
Demographics Similar to Immigrants from Australia by Cognitive Disability
In terms of cognitive disability, the demographic groups most similar to Immigrants from Australia are Celtic (17.1%, a difference of 0.070%), Immigrants from Latvia (17.2%, a difference of 0.11%), Brazilian (17.1%, a difference of 0.12%), Sri Lankan (17.1%, a difference of 0.12%), and Immigrants from Malaysia (17.1%, a difference of 0.14%).
| Demographics | Rating | Rank | Cognitive Disability |
| Basques | 85.5 /100 | #150 | Excellent 17.1% |
| Syrians | 83.0 /100 | #151 | Excellent 17.1% |
| Immigrants | Indonesia | 82.7 /100 | #152 | Excellent 17.1% |
| Immigrants | Kazakhstan | 80.5 /100 | #153 | Excellent 17.1% |
| Immigrants | Malaysia | 79.3 /100 | #154 | Good 17.1% |
| Brazilians | 78.9 /100 | #155 | Good 17.1% |
| Sri Lankans | 78.9 /100 | #156 | Good 17.1% |
| Immigrants | Australia | 76.0 /100 | #157 | Good 17.1% |
| Celtics | 74.1 /100 | #158 | Good 17.1% |
| Immigrants | Latvia | 73.2 /100 | #159 | Good 17.2% |
| Australians | 72.4 /100 | #160 | Good 17.2% |
| Americans | 72.2 /100 | #161 | Good 17.2% |
| Yugoslavians | 71.6 /100 | #162 | Good 17.2% |
| Immigrants | Switzerland | 71.5 /100 | #163 | Good 17.2% |
| Armenians | 70.1 /100 | #164 | Good 17.2% |
Demographics Similar to Japanese by Cognitive Disability
In terms of cognitive disability, the demographic groups most similar to Japanese are Blackfeet (18.3%, a difference of 0.0%), Ghanaian (18.3%, a difference of 0.030%), Creek (18.3%, a difference of 0.060%), Immigrants from Burma/Myanmar (18.2%, a difference of 0.14%), and German Russian (18.2%, a difference of 0.17%).
| Demographics | Rating | Rank | Cognitive Disability |
| Ottawa | 0.1 /100 | #291 | Tragic 18.2% |
| Iroquois | 0.1 /100 | #292 | Tragic 18.2% |
| Central American Indians | 0.1 /100 | #293 | Tragic 18.2% |
| British West Indians | 0.1 /100 | #294 | Tragic 18.2% |
| German Russians | 0.0 /100 | #295 | Tragic 18.2% |
| Immigrants | Burma/Myanmar | 0.0 /100 | #296 | Tragic 18.2% |
| Blackfeet | 0.0 /100 | #297 | Tragic 18.3% |
| Japanese | 0.0 /100 | #298 | Tragic 18.3% |
| Ghanaians | 0.0 /100 | #299 | Tragic 18.3% |
| Creek | 0.0 /100 | #300 | Tragic 18.3% |
| Immigrants | Ghana | 0.0 /100 | #301 | Tragic 18.3% |
| Barbadians | 0.0 /100 | #302 | Tragic 18.3% |
| Immigrants | Kenya | 0.0 /100 | #303 | Tragic 18.3% |
| Immigrants | Eritrea | 0.0 /100 | #304 | Tragic 18.3% |
| Colville | 0.0 /100 | #305 | Tragic 18.3% |