Immigrants from Bolivia vs Immigrants from India Cognitive Disability
COMPARE
Immigrants from Bolivia
Immigrants from India
Cognitive Disability
Cognitive Disability Comparison
Immigrants from Bolivia
Immigrants from India
16.3%
COGNITIVE DISABILITY
100.0/ 100
METRIC RATING
19th/ 347
METRIC RANK
15.9%
COGNITIVE DISABILITY
100.0/ 100
METRIC RATING
2nd/ 347
METRIC RANK
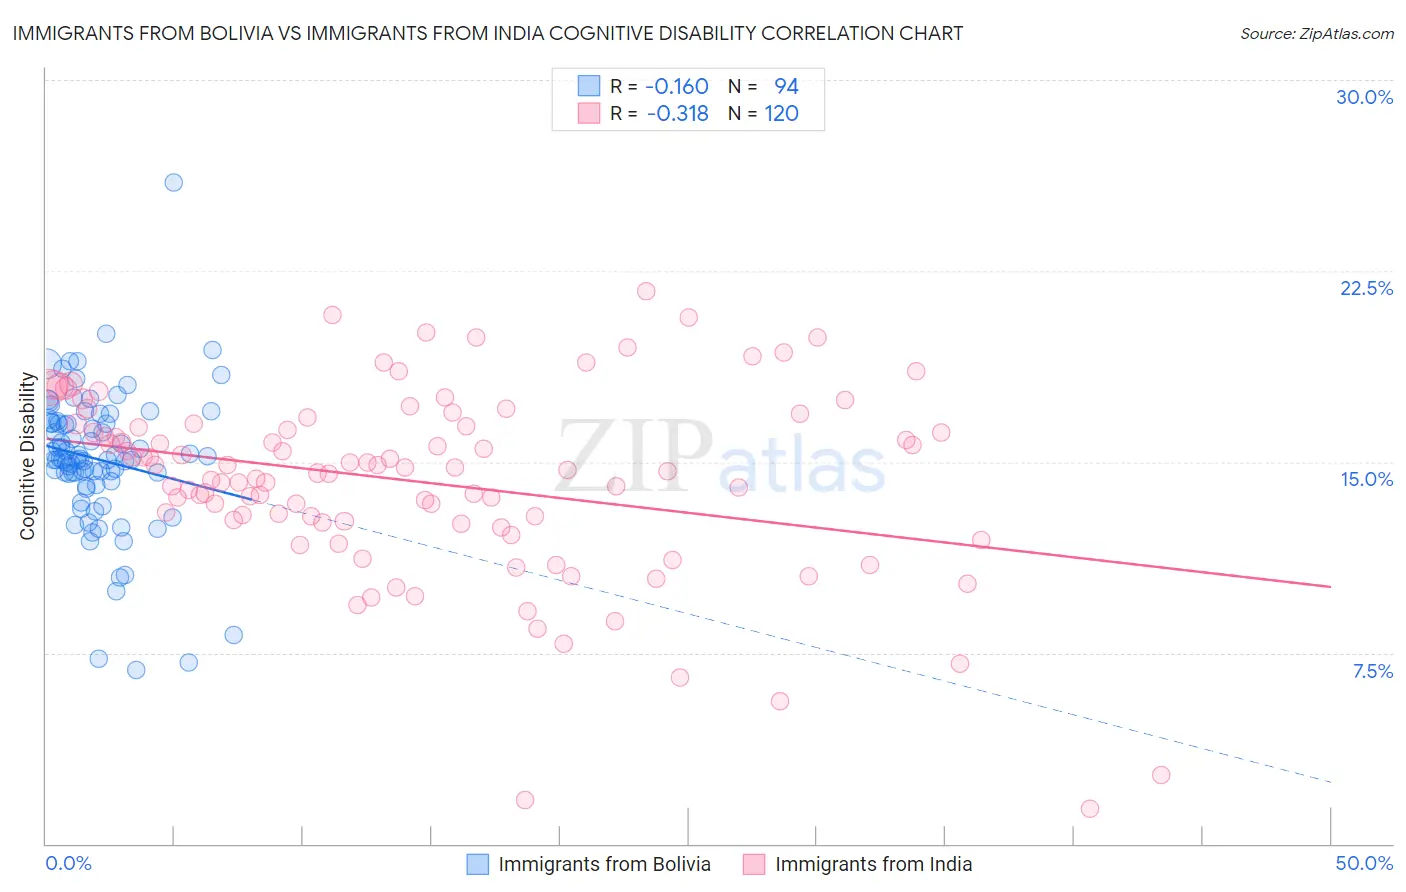
Immigrants from Bolivia vs Immigrants from India Cognitive Disability Correlation Chart
The statistical analysis conducted on geographies consisting of 158,730,419 people shows a poor negative correlation between the proportion of Immigrants from Bolivia and percentage of population with cognitive disability in the United States with a correlation coefficient (R) of -0.160 and weighted average of 16.3%. Similarly, the statistical analysis conducted on geographies consisting of 434,093,064 people shows a mild negative correlation between the proportion of Immigrants from India and percentage of population with cognitive disability in the United States with a correlation coefficient (R) of -0.318 and weighted average of 15.9%, a difference of 2.6%.
Cognitive Disability Correlation Summary
| Measurement | Immigrants from Bolivia | Immigrants from India |
| Minimum | 6.8% | 1.4% |
| Maximum | 26.0% | 21.7% |
| Range | 19.2% | 20.3% |
| Mean | 15.1% | 14.2% |
| Median | 15.1% | 14.6% |
| Interquartile 25% (IQ1) | 14.2% | 12.7% |
| Interquartile 75% (IQ3) | 16.5% | 16.4% |
| Interquartile Range (IQR) | 2.3% | 3.8% |
| Standard Deviation (Sample) | 2.8% | 3.7% |
| Standard Deviation (Population) | 2.8% | 3.7% |
Demographics Similar to Immigrants from Bolivia and Immigrants from India by Cognitive Disability
In terms of cognitive disability, the demographic groups most similar to Immigrants from Bolivia are Immigrants from Northern Europe (16.3%, a difference of 0.0%), Bulgarian (16.3%, a difference of 0.010%), Immigrants from North Macedonia (16.3%, a difference of 0.070%), Eastern European (16.3%, a difference of 0.090%), and Immigrants from Greece (16.3%, a difference of 0.38%). Similarly, the demographic groups most similar to Immigrants from India are Chinese (15.9%, a difference of 0.080%), Immigrants from Lithuania (16.0%, a difference of 0.27%), Immigrants from Hong Kong (16.0%, a difference of 0.68%), Immigrants from Taiwan (15.7%, a difference of 1.3%), and Thai (16.1%, a difference of 1.3%).
| Demographics | Rating | Rank | Cognitive Disability |
| Immigrants | Taiwan | 100.0 /100 | #1 | Exceptional 15.7% |
| Immigrants | India | 100.0 /100 | #2 | Exceptional 15.9% |
| Chinese | 100.0 /100 | #3 | Exceptional 15.9% |
| Immigrants | Lithuania | 100.0 /100 | #4 | Exceptional 16.0% |
| Immigrants | Hong Kong | 100.0 /100 | #5 | Exceptional 16.0% |
| Thais | 100.0 /100 | #6 | Exceptional 16.1% |
| Immigrants | Ireland | 100.0 /100 | #7 | Exceptional 16.1% |
| Immigrants | Poland | 100.0 /100 | #8 | Exceptional 16.1% |
| Assyrians/Chaldeans/Syriacs | 100.0 /100 | #9 | Exceptional 16.2% |
| Immigrants | Scotland | 100.0 /100 | #10 | Exceptional 16.2% |
| Immigrants | Czechoslovakia | 100.0 /100 | #11 | Exceptional 16.2% |
| Maltese | 100.0 /100 | #12 | Exceptional 16.2% |
| Lithuanians | 100.0 /100 | #13 | Exceptional 16.3% |
| Immigrants | Austria | 100.0 /100 | #14 | Exceptional 16.3% |
| Immigrants | Greece | 100.0 /100 | #15 | Exceptional 16.3% |
| Eastern Europeans | 100.0 /100 | #16 | Exceptional 16.3% |
| Immigrants | North Macedonia | 100.0 /100 | #17 | Exceptional 16.3% |
| Immigrants | Northern Europe | 100.0 /100 | #18 | Exceptional 16.3% |
| Immigrants | Bolivia | 100.0 /100 | #19 | Exceptional 16.3% |
| Bulgarians | 100.0 /100 | #20 | Exceptional 16.3% |