Cherokee vs Immigrants from India Cognitive Disability
COMPARE
Cherokee
Immigrants from India
Cognitive Disability
Cognitive Disability Comparison
Cherokee
Immigrants from India
18.0%
COGNITIVE DISABILITY
0.3/ 100
METRIC RATING
268th/ 347
METRIC RANK
15.9%
COGNITIVE DISABILITY
100.0/ 100
METRIC RATING
2nd/ 347
METRIC RANK
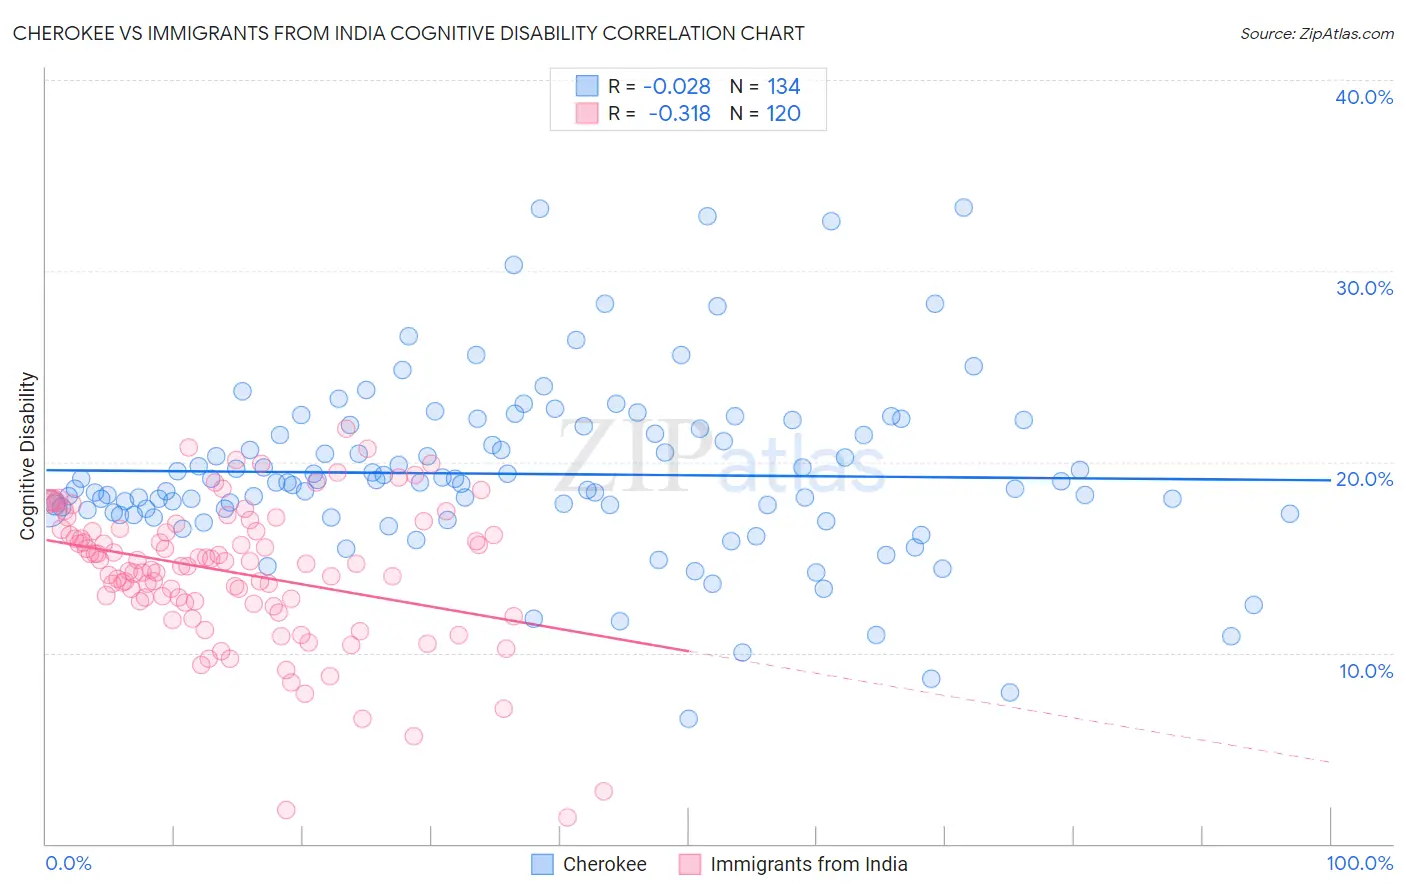
Cherokee vs Immigrants from India Cognitive Disability Correlation Chart
The statistical analysis conducted on geographies consisting of 493,579,775 people shows no correlation between the proportion of Cherokee and percentage of population with cognitive disability in the United States with a correlation coefficient (R) of -0.028 and weighted average of 18.0%. Similarly, the statistical analysis conducted on geographies consisting of 434,093,064 people shows a mild negative correlation between the proportion of Immigrants from India and percentage of population with cognitive disability in the United States with a correlation coefficient (R) of -0.318 and weighted average of 15.9%, a difference of 13.0%.
Cognitive Disability Correlation Summary
| Measurement | Cherokee | Immigrants from India |
| Minimum | 6.5% | 1.4% |
| Maximum | 33.3% | 21.7% |
| Range | 26.8% | 20.3% |
| Mean | 19.4% | 14.2% |
| Median | 18.9% | 14.6% |
| Interquartile 25% (IQ1) | 17.4% | 12.7% |
| Interquartile 75% (IQ3) | 21.8% | 16.4% |
| Interquartile Range (IQR) | 4.4% | 3.8% |
| Standard Deviation (Sample) | 4.6% | 3.7% |
| Standard Deviation (Population) | 4.6% | 3.7% |
Similar Demographics by Cognitive Disability
Demographics Similar to Cherokee by Cognitive Disability
In terms of cognitive disability, the demographic groups most similar to Cherokee are Nepalese (18.0%, a difference of 0.010%), Spanish American (18.0%, a difference of 0.070%), Belizean (18.0%, a difference of 0.070%), Menominee (18.0%, a difference of 0.10%), and Honduran (18.0%, a difference of 0.14%).
| Demographics | Rating | Rank | Cognitive Disability |
| Guamanians/Chamorros | 0.5 /100 | #261 | Tragic 17.9% |
| Sierra Leoneans | 0.4 /100 | #262 | Tragic 17.9% |
| Immigrants | Barbados | 0.4 /100 | #263 | Tragic 17.9% |
| Menominee | 0.4 /100 | #264 | Tragic 18.0% |
| Spanish Americans | 0.4 /100 | #265 | Tragic 18.0% |
| Belizeans | 0.4 /100 | #266 | Tragic 18.0% |
| Nepalese | 0.3 /100 | #267 | Tragic 18.0% |
| Cherokee | 0.3 /100 | #268 | Tragic 18.0% |
| Hondurans | 0.3 /100 | #269 | Tragic 18.0% |
| Immigrants | Bahamas | 0.3 /100 | #270 | Tragic 18.0% |
| Potawatomi | 0.2 /100 | #271 | Tragic 18.0% |
| Immigrants | Honduras | 0.2 /100 | #272 | Tragic 18.0% |
| Immigrants | Nepal | 0.2 /100 | #273 | Tragic 18.0% |
| Immigrants | Nigeria | 0.2 /100 | #274 | Tragic 18.0% |
| Immigrants | Laos | 0.2 /100 | #275 | Tragic 18.1% |
Demographics Similar to Immigrants from India by Cognitive Disability
In terms of cognitive disability, the demographic groups most similar to Immigrants from India are Chinese (15.9%, a difference of 0.080%), Immigrants from Lithuania (16.0%, a difference of 0.27%), Immigrants from Hong Kong (16.0%, a difference of 0.68%), Immigrants from Taiwan (15.7%, a difference of 1.3%), and Thai (16.1%, a difference of 1.3%).
| Demographics | Rating | Rank | Cognitive Disability |
| Immigrants | Taiwan | 100.0 /100 | #1 | Exceptional 15.7% |
| Immigrants | India | 100.0 /100 | #2 | Exceptional 15.9% |
| Chinese | 100.0 /100 | #3 | Exceptional 15.9% |
| Immigrants | Lithuania | 100.0 /100 | #4 | Exceptional 16.0% |
| Immigrants | Hong Kong | 100.0 /100 | #5 | Exceptional 16.0% |
| Thais | 100.0 /100 | #6 | Exceptional 16.1% |
| Immigrants | Ireland | 100.0 /100 | #7 | Exceptional 16.1% |
| Immigrants | Poland | 100.0 /100 | #8 | Exceptional 16.1% |
| Assyrians/Chaldeans/Syriacs | 100.0 /100 | #9 | Exceptional 16.2% |
| Immigrants | Scotland | 100.0 /100 | #10 | Exceptional 16.2% |
| Immigrants | Czechoslovakia | 100.0 /100 | #11 | Exceptional 16.2% |
| Maltese | 100.0 /100 | #12 | Exceptional 16.2% |
| Lithuanians | 100.0 /100 | #13 | Exceptional 16.3% |
| Immigrants | Austria | 100.0 /100 | #14 | Exceptional 16.3% |
| Immigrants | Greece | 100.0 /100 | #15 | Exceptional 16.3% |