Immigrants from Australia vs Immigrants from Burma/Myanmar Disability Age 5 to 17
COMPARE
Immigrants from Australia
Immigrants from Burma/Myanmar
Disability Age 5 to 17
Disability Age 5 to 17 Comparison
Immigrants from Australia
Immigrants from Burma/Myanmar
5.0%
DISABILITY AGE 5 TO 17
100.0/ 100
METRIC RATING
41st/ 347
METRIC RANK
5.6%
DISABILITY AGE 5 TO 17
59.3/ 100
METRIC RATING
167th/ 347
METRIC RANK
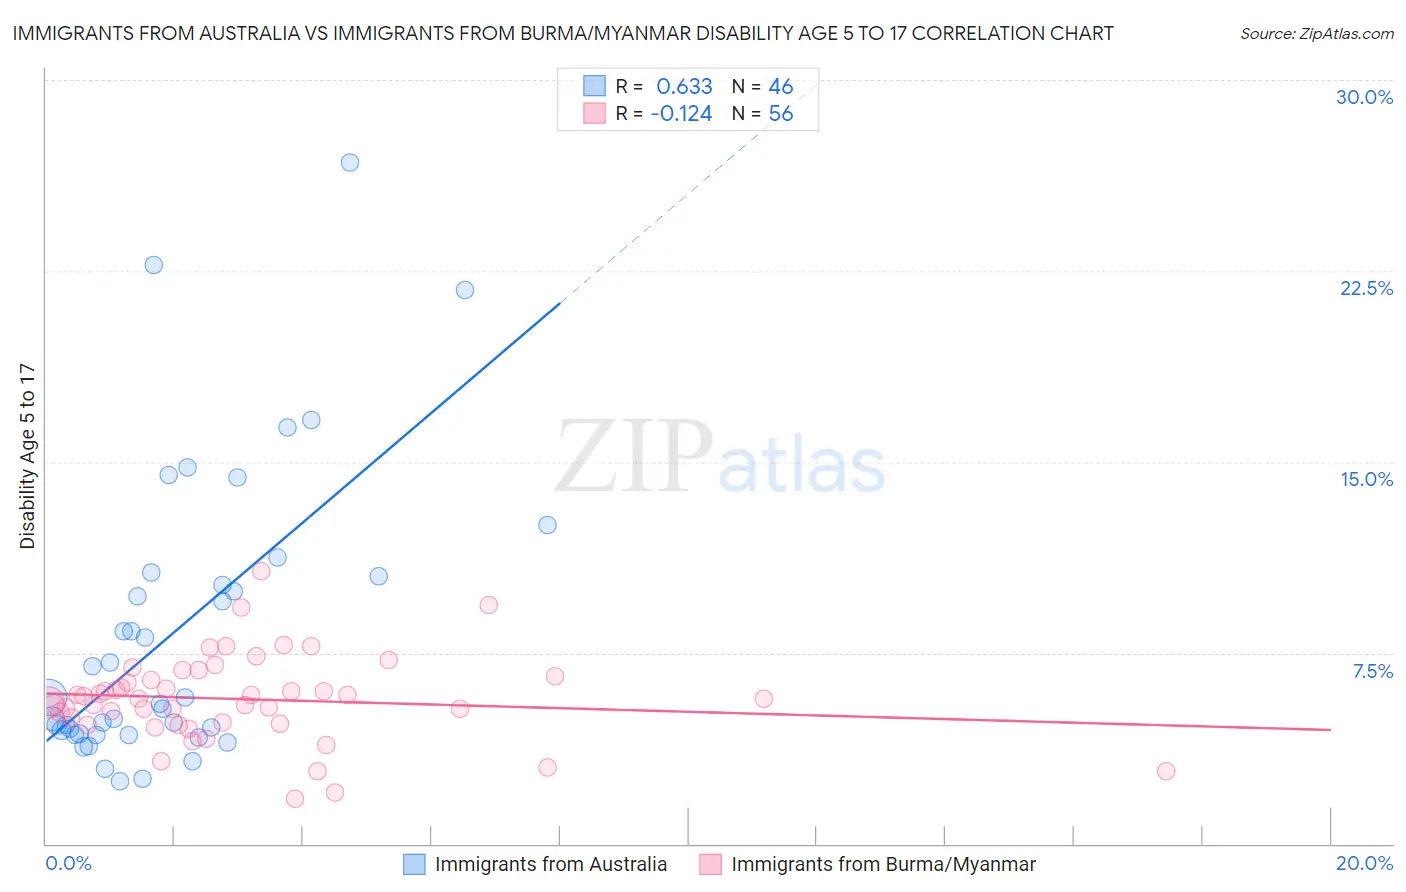
Immigrants from Australia vs Immigrants from Burma/Myanmar Disability Age 5 to 17 Correlation Chart
The statistical analysis conducted on geographies consisting of 226,040,529 people shows a significant positive correlation between the proportion of Immigrants from Australia and percentage of population with a disability between the ages 5 and 17 in the United States with a correlation coefficient (R) of 0.633 and weighted average of 5.0%. Similarly, the statistical analysis conducted on geographies consisting of 171,966,174 people shows a poor negative correlation between the proportion of Immigrants from Burma/Myanmar and percentage of population with a disability between the ages 5 and 17 in the United States with a correlation coefficient (R) of -0.124 and weighted average of 5.6%, a difference of 11.1%.
Disability Age 5 to 17 Correlation Summary
| Measurement | Immigrants from Australia | Immigrants from Burma/Myanmar |
| Minimum | 2.5% | 1.8% |
| Maximum | 26.8% | 10.7% |
| Range | 24.3% | 8.9% |
| Mean | 8.3% | 5.7% |
| Median | 5.6% | 5.7% |
| Interquartile 25% (IQ1) | 4.3% | 4.7% |
| Interquartile 75% (IQ3) | 10.5% | 6.5% |
| Interquartile Range (IQR) | 6.2% | 1.8% |
| Standard Deviation (Sample) | 5.7% | 1.7% |
| Standard Deviation (Population) | 5.6% | 1.7% |
Similar Demographics by Disability Age 5 to 17
Demographics Similar to Immigrants from Australia by Disability Age 5 to 17
In terms of disability age 5 to 17, the demographic groups most similar to Immigrants from Australia are Immigrants from Sri Lanka (5.0%, a difference of 0.010%), Okinawan (5.0%, a difference of 0.080%), Immigrants from Philippines (5.0%, a difference of 0.16%), Immigrants from Argentina (5.0%, a difference of 0.16%), and Immigrants from Belarus (5.0%, a difference of 0.20%).
| Demographics | Rating | Rank | Disability Age 5 to 17 |
| Israelis | 100.0 /100 | #34 | Exceptional 5.0% |
| Bolivians | 100.0 /100 | #35 | Exceptional 5.0% |
| Immigrants | Egypt | 100.0 /100 | #36 | Exceptional 5.0% |
| Immigrants | Belarus | 100.0 /100 | #37 | Exceptional 5.0% |
| Immigrants | Philippines | 100.0 /100 | #38 | Exceptional 5.0% |
| Immigrants | Argentina | 100.0 /100 | #39 | Exceptional 5.0% |
| Okinawans | 100.0 /100 | #40 | Exceptional 5.0% |
| Immigrants | Australia | 100.0 /100 | #41 | Exceptional 5.0% |
| Immigrants | Sri Lanka | 100.0 /100 | #42 | Exceptional 5.0% |
| Immigrants | Russia | 100.0 /100 | #43 | Exceptional 5.0% |
| Egyptians | 100.0 /100 | #44 | Exceptional 5.0% |
| Tongans | 100.0 /100 | #45 | Exceptional 5.0% |
| Assyrians/Chaldeans/Syriacs | 100.0 /100 | #46 | Exceptional 5.0% |
| Vietnamese | 100.0 /100 | #47 | Exceptional 5.1% |
| Koreans | 100.0 /100 | #48 | Exceptional 5.1% |
Demographics Similar to Immigrants from Burma/Myanmar by Disability Age 5 to 17
In terms of disability age 5 to 17, the demographic groups most similar to Immigrants from Burma/Myanmar are Greek (5.6%, a difference of 0.070%), Lebanese (5.6%, a difference of 0.11%), Immigrants from Scotland (5.6%, a difference of 0.13%), Iraqi (5.6%, a difference of 0.17%), and Immigrants from Norway (5.6%, a difference of 0.18%).
| Demographics | Rating | Rank | Disability Age 5 to 17 |
| South Africans | 73.3 /100 | #160 | Good 5.5% |
| Immigrants | Saudi Arabia | 69.1 /100 | #161 | Good 5.5% |
| Zimbabweans | 67.2 /100 | #162 | Good 5.5% |
| Immigrants | Southern Europe | 64.0 /100 | #163 | Good 5.6% |
| Immigrants | Scotland | 61.9 /100 | #164 | Good 5.6% |
| Lebanese | 61.4 /100 | #165 | Good 5.6% |
| Greeks | 60.6 /100 | #166 | Good 5.6% |
| Immigrants | Burma/Myanmar | 59.3 /100 | #167 | Average 5.6% |
| Iraqis | 56.0 /100 | #168 | Average 5.6% |
| Immigrants | Norway | 55.7 /100 | #169 | Average 5.6% |
| Serbians | 54.0 /100 | #170 | Average 5.6% |
| Immigrants | Iraq | 53.9 /100 | #171 | Average 5.6% |
| Ukrainians | 51.5 /100 | #172 | Average 5.6% |
| Uruguayans | 51.0 /100 | #173 | Average 5.6% |
| Costa Ricans | 50.0 /100 | #174 | Average 5.6% |