Immigrants from Australia vs Immigrants from Malaysia Disability Age 5 to 17
COMPARE
Immigrants from Australia
Immigrants from Malaysia
Disability Age 5 to 17
Disability Age 5 to 17 Comparison
Immigrants from Australia
Immigrants from Malaysia
5.0%
DISABILITY AGE 5 TO 17
100.0/ 100
METRIC RATING
41st/ 347
METRIC RANK
5.0%
DISABILITY AGE 5 TO 17
100.0/ 100
METRIC RATING
30th/ 347
METRIC RANK
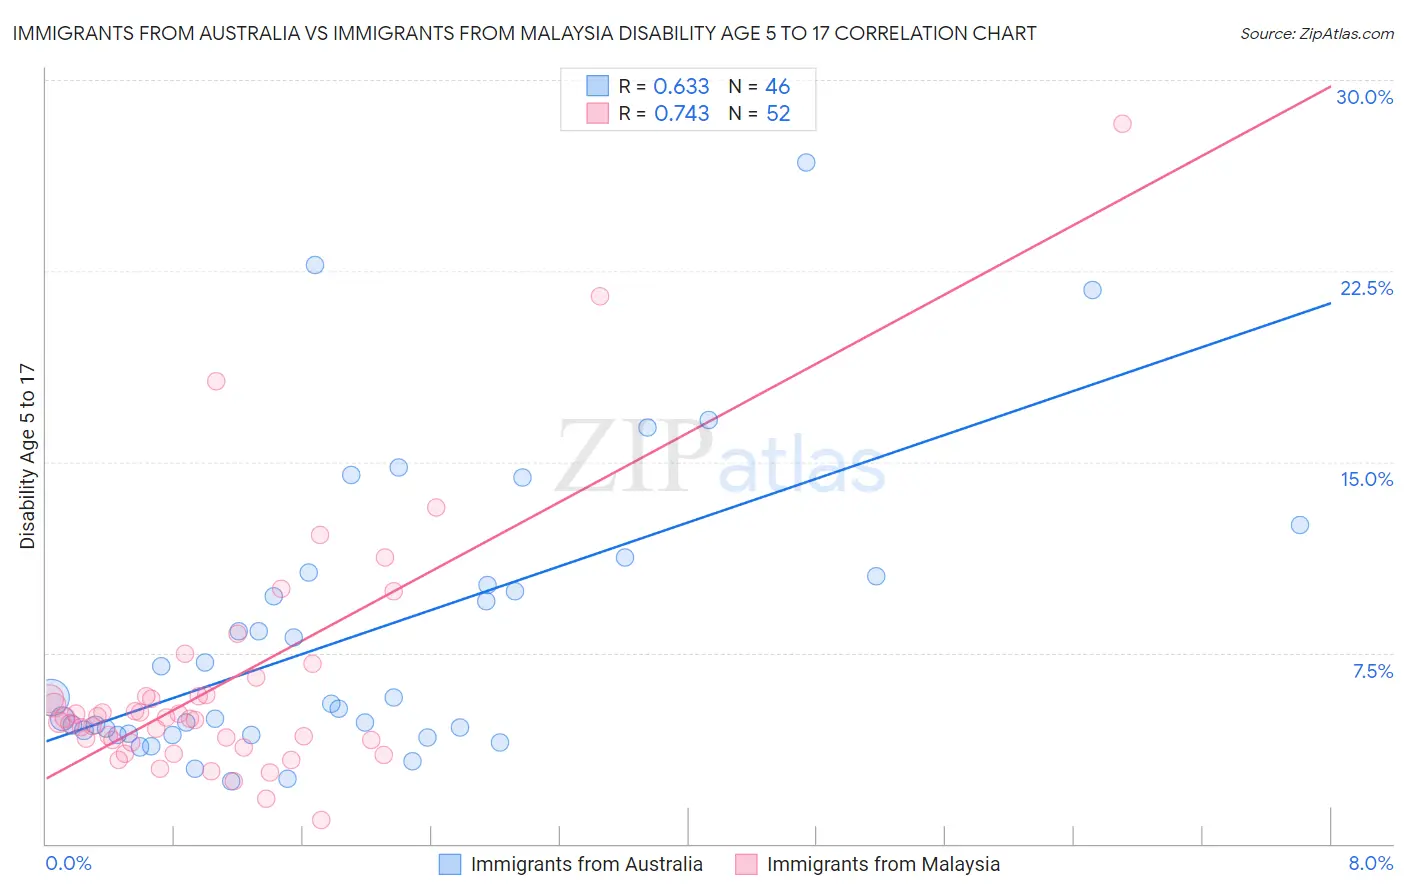
Immigrants from Australia vs Immigrants from Malaysia Disability Age 5 to 17 Correlation Chart
The statistical analysis conducted on geographies consisting of 226,040,529 people shows a significant positive correlation between the proportion of Immigrants from Australia and percentage of population with a disability between the ages 5 and 17 in the United States with a correlation coefficient (R) of 0.633 and weighted average of 5.0%. Similarly, the statistical analysis conducted on geographies consisting of 197,341,469 people shows a strong positive correlation between the proportion of Immigrants from Malaysia and percentage of population with a disability between the ages 5 and 17 in the United States with a correlation coefficient (R) of 0.743 and weighted average of 5.0%, a difference of 1.2%.
Disability Age 5 to 17 Correlation Summary
| Measurement | Immigrants from Australia | Immigrants from Malaysia |
| Minimum | 2.5% | 0.95% |
| Maximum | 26.8% | 28.3% |
| Range | 24.3% | 27.4% |
| Mean | 8.3% | 6.3% |
| Median | 5.6% | 4.9% |
| Interquartile 25% (IQ1) | 4.3% | 4.0% |
| Interquartile 75% (IQ3) | 10.5% | 5.8% |
| Interquartile Range (IQR) | 6.2% | 1.8% |
| Standard Deviation (Sample) | 5.7% | 4.9% |
| Standard Deviation (Population) | 5.6% | 4.8% |
Demographics Similar to Immigrants from Australia and Immigrants from Malaysia by Disability Age 5 to 17
In terms of disability age 5 to 17, the demographic groups most similar to Immigrants from Australia are Immigrants from Sri Lanka (5.0%, a difference of 0.010%), Okinawan (5.0%, a difference of 0.080%), Immigrants from Philippines (5.0%, a difference of 0.16%), Immigrants from Argentina (5.0%, a difference of 0.16%), and Immigrants from Belarus (5.0%, a difference of 0.20%). Similarly, the demographic groups most similar to Immigrants from Malaysia are Immigrants from Serbia (4.9%, a difference of 0.22%), Immigrants from Pakistan (5.0%, a difference of 0.25%), Soviet Union (5.0%, a difference of 0.28%), Immigrants from Indonesia (5.0%, a difference of 0.61%), and Immigrants from Japan (4.9%, a difference of 0.70%).
| Demographics | Rating | Rank | Disability Age 5 to 17 |
| Immigrants | Asia | 100.0 /100 | #25 | Exceptional 4.8% |
| Bhutanese | 100.0 /100 | #26 | Exceptional 4.9% |
| Taiwanese | 100.0 /100 | #27 | Exceptional 4.9% |
| Immigrants | Japan | 100.0 /100 | #28 | Exceptional 4.9% |
| Immigrants | Serbia | 100.0 /100 | #29 | Exceptional 4.9% |
| Immigrants | Malaysia | 100.0 /100 | #30 | Exceptional 5.0% |
| Immigrants | Pakistan | 100.0 /100 | #31 | Exceptional 5.0% |
| Soviet Union | 100.0 /100 | #32 | Exceptional 5.0% |
| Immigrants | Indonesia | 100.0 /100 | #33 | Exceptional 5.0% |
| Israelis | 100.0 /100 | #34 | Exceptional 5.0% |
| Bolivians | 100.0 /100 | #35 | Exceptional 5.0% |
| Immigrants | Egypt | 100.0 /100 | #36 | Exceptional 5.0% |
| Immigrants | Belarus | 100.0 /100 | #37 | Exceptional 5.0% |
| Immigrants | Philippines | 100.0 /100 | #38 | Exceptional 5.0% |
| Immigrants | Argentina | 100.0 /100 | #39 | Exceptional 5.0% |
| Okinawans | 100.0 /100 | #40 | Exceptional 5.0% |
| Immigrants | Australia | 100.0 /100 | #41 | Exceptional 5.0% |
| Immigrants | Sri Lanka | 100.0 /100 | #42 | Exceptional 5.0% |
| Immigrants | Russia | 100.0 /100 | #43 | Exceptional 5.0% |
| Egyptians | 100.0 /100 | #44 | Exceptional 5.0% |
| Tongans | 100.0 /100 | #45 | Exceptional 5.0% |