Immigrants from Armenia vs Immigrants from Denmark In Labor Force | Age 20-64
COMPARE
Immigrants from Armenia
Immigrants from Denmark
In Labor Force | Age 20-64
In Labor Force | Age 20-64 Comparison
Immigrants from Armenia
Immigrants from Denmark
79.2%
IN LABOR FORCE | AGE 20-64
12.2/ 100
METRIC RATING
214th/ 347
METRIC RANK
79.4%
IN LABOR FORCE | AGE 20-64
26.9/ 100
METRIC RATING
192nd/ 347
METRIC RANK
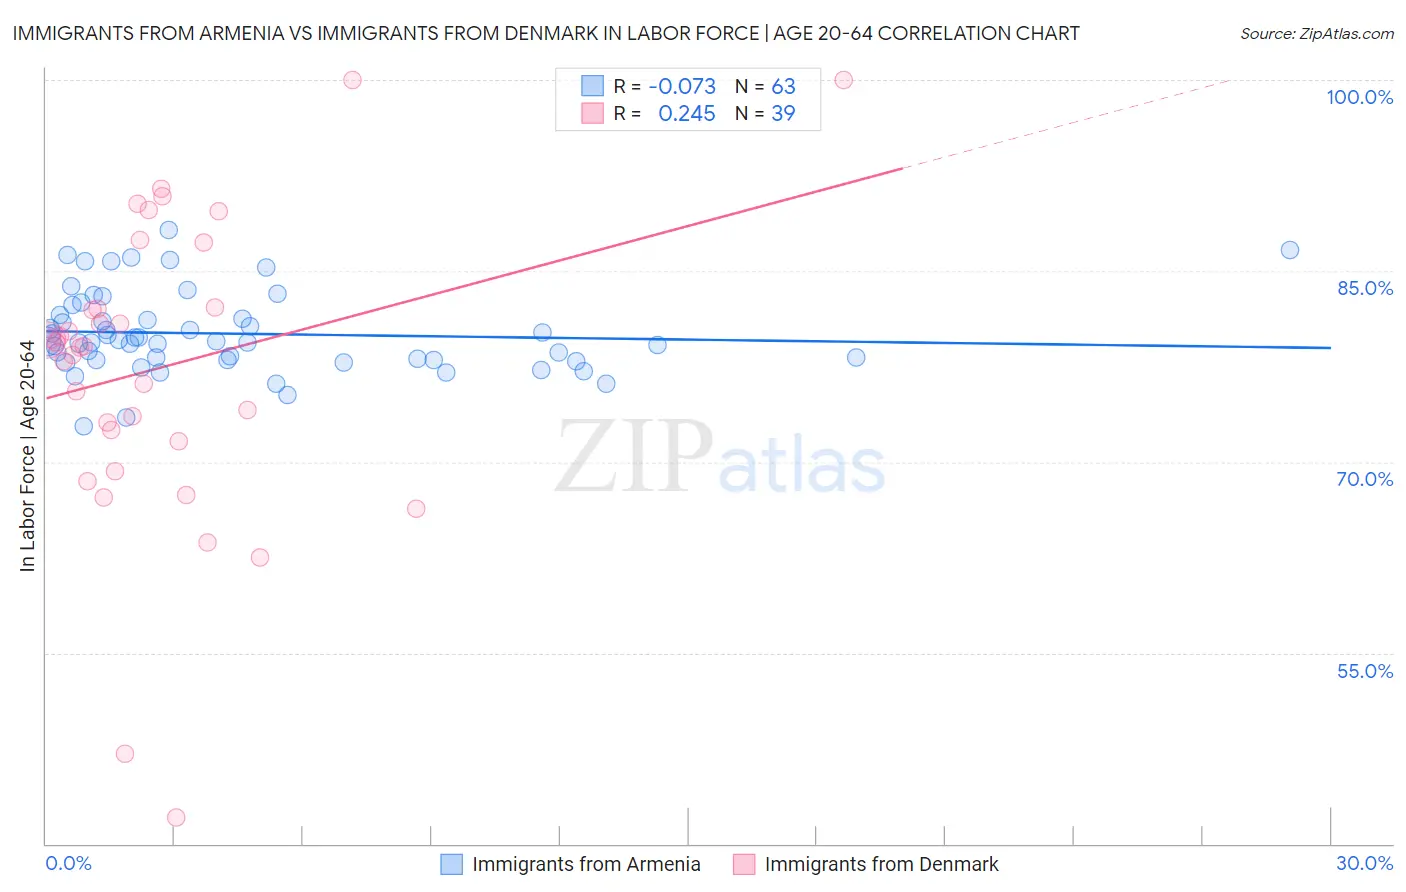
Immigrants from Armenia vs Immigrants from Denmark In Labor Force | Age 20-64 Correlation Chart
The statistical analysis conducted on geographies consisting of 97,718,343 people shows a slight negative correlation between the proportion of Immigrants from Armenia and labor force participation rate among population between the ages 20 and 64 in the United States with a correlation coefficient (R) of -0.073 and weighted average of 79.2%. Similarly, the statistical analysis conducted on geographies consisting of 136,432,253 people shows a weak positive correlation between the proportion of Immigrants from Denmark and labor force participation rate among population between the ages 20 and 64 in the United States with a correlation coefficient (R) of 0.245 and weighted average of 79.4%, a difference of 0.20%.
In Labor Force | Age 20-64 Correlation Summary
| Measurement | Immigrants from Armenia | Immigrants from Denmark |
| Minimum | 72.8% | 42.1% |
| Maximum | 88.2% | 100.0% |
| Range | 15.4% | 57.9% |
| Mean | 80.1% | 77.4% |
| Median | 79.5% | 79.1% |
| Interquartile 25% (IQ1) | 78.0% | 71.6% |
| Interquartile 75% (IQ3) | 81.5% | 82.1% |
| Interquartile Range (IQR) | 3.5% | 10.5% |
| Standard Deviation (Sample) | 3.2% | 11.9% |
| Standard Deviation (Population) | 3.2% | 11.7% |
Similar Demographics by In Labor Force | Age 20-64
Demographics Similar to Immigrants from Armenia by In Labor Force | Age 20-64
In terms of in labor force | age 20-64, the demographic groups most similar to Immigrants from Armenia are Immigrants from Norway (79.2%, a difference of 0.0%), Immigrants from Portugal (79.3%, a difference of 0.010%), Arab (79.2%, a difference of 0.010%), Irish (79.3%, a difference of 0.020%), and Immigrants from Western Asia (79.2%, a difference of 0.020%).
| Demographics | Rating | Rank | In Labor Force | Age 20-64 |
| Sub-Saharan Africans | 16.5 /100 | #207 | Poor 79.3% |
| British | 16.5 /100 | #208 | Poor 79.3% |
| Bangladeshis | 16.4 /100 | #209 | Poor 79.3% |
| Haitians | 16.1 /100 | #210 | Poor 79.3% |
| Europeans | 15.3 /100 | #211 | Poor 79.3% |
| Irish | 13.2 /100 | #212 | Poor 79.3% |
| Immigrants | Portugal | 12.8 /100 | #213 | Poor 79.3% |
| Immigrants | Armenia | 12.2 /100 | #214 | Poor 79.2% |
| Immigrants | Norway | 12.0 /100 | #215 | Poor 79.2% |
| Arabs | 11.4 /100 | #216 | Poor 79.2% |
| Immigrants | Western Asia | 11.0 /100 | #217 | Poor 79.2% |
| Immigrants | England | 9.3 /100 | #218 | Tragic 79.2% |
| French Canadians | 8.4 /100 | #219 | Tragic 79.2% |
| Immigrants | Immigrants | 7.7 /100 | #220 | Tragic 79.2% |
| Hungarians | 7.2 /100 | #221 | Tragic 79.2% |
Demographics Similar to Immigrants from Denmark by In Labor Force | Age 20-64
In terms of in labor force | age 20-64, the demographic groups most similar to Immigrants from Denmark are Indonesian (79.4%, a difference of 0.010%), Swiss (79.4%, a difference of 0.020%), Immigrants from Thailand (79.4%, a difference of 0.020%), Immigrants from Austria (79.4%, a difference of 0.030%), and Immigrants from El Salvador (79.4%, a difference of 0.040%).
| Demographics | Rating | Rank | In Labor Force | Age 20-64 |
| Israelis | 34.7 /100 | #185 | Fair 79.5% |
| Northern Europeans | 34.5 /100 | #186 | Fair 79.5% |
| Assyrians/Chaldeans/Syriacs | 33.3 /100 | #187 | Fair 79.4% |
| Immigrants | Haiti | 32.1 /100 | #188 | Fair 79.4% |
| Immigrants | El Salvador | 30.9 /100 | #189 | Fair 79.4% |
| Immigrants | Syria | 30.8 /100 | #190 | Fair 79.4% |
| Swiss | 28.9 /100 | #191 | Fair 79.4% |
| Immigrants | Denmark | 26.9 /100 | #192 | Fair 79.4% |
| Indonesians | 26.1 /100 | #193 | Fair 79.4% |
| Immigrants | Thailand | 24.8 /100 | #194 | Fair 79.4% |
| Immigrants | Austria | 23.7 /100 | #195 | Fair 79.4% |
| Ecuadorians | 23.1 /100 | #196 | Fair 79.4% |
| Immigrants | Senegal | 22.5 /100 | #197 | Fair 79.4% |
| Immigrants | Laos | 21.5 /100 | #198 | Fair 79.4% |
| Dutch | 20.2 /100 | #199 | Fair 79.3% |