Immigrants from Albania vs Immigrants from Eritrea Self-Care Disability
COMPARE
Immigrants from Albania
Immigrants from Eritrea
Self-Care Disability
Self-Care Disability Comparison
Immigrants from Albania
Immigrants from Eritrea
2.6%
SELF-CARE DISABILITY
0.6/ 100
METRIC RATING
247th/ 347
METRIC RANK
2.2%
SELF-CARE DISABILITY
100.0/ 100
METRIC RATING
19th/ 347
METRIC RANK
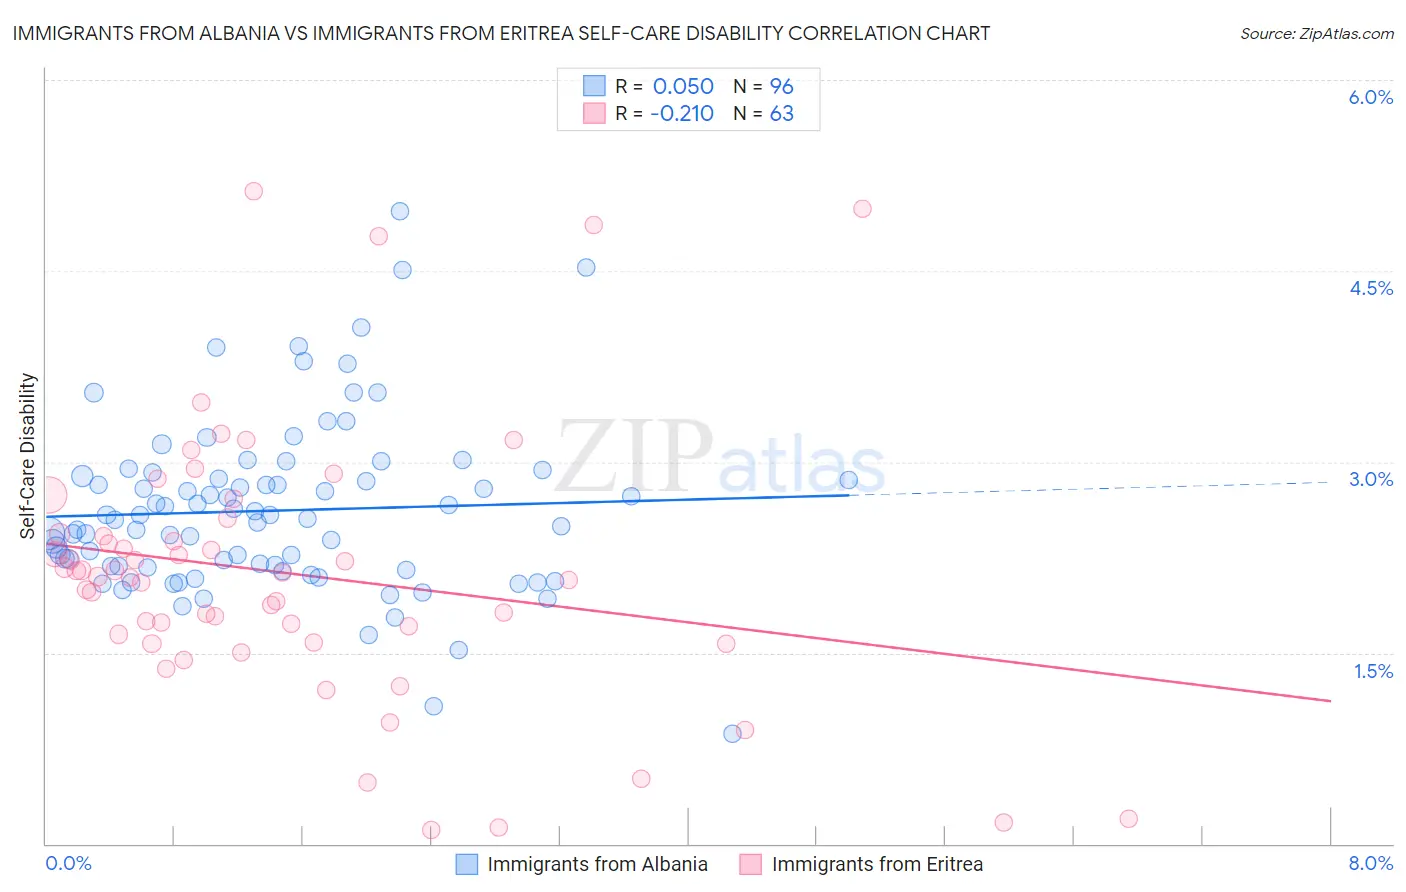
Immigrants from Albania vs Immigrants from Eritrea Self-Care Disability Correlation Chart
The statistical analysis conducted on geographies consisting of 119,364,841 people shows a slight positive correlation between the proportion of Immigrants from Albania and percentage of population with self-care disability in the United States with a correlation coefficient (R) of 0.050 and weighted average of 2.6%. Similarly, the statistical analysis conducted on geographies consisting of 104,840,277 people shows a weak negative correlation between the proportion of Immigrants from Eritrea and percentage of population with self-care disability in the United States with a correlation coefficient (R) of -0.210 and weighted average of 2.2%, a difference of 17.9%.
Self-Care Disability Correlation Summary
| Measurement | Immigrants from Albania | Immigrants from Eritrea |
| Minimum | 0.86% | 0.11% |
| Maximum | 5.0% | 5.1% |
| Range | 4.1% | 5.0% |
| Mean | 2.6% | 2.1% |
| Median | 2.5% | 2.1% |
| Interquartile 25% (IQ1) | 2.2% | 1.6% |
| Interquartile 75% (IQ3) | 2.9% | 2.4% |
| Interquartile Range (IQR) | 0.70% | 0.85% |
| Standard Deviation (Sample) | 0.68% | 1.1% |
| Standard Deviation (Population) | 0.67% | 1.1% |
Similar Demographics by Self-Care Disability
Demographics Similar to Immigrants from Albania by Self-Care Disability
In terms of self-care disability, the demographic groups most similar to Immigrants from Albania are Nicaraguan (2.6%, a difference of 0.0%), Cheyenne (2.6%, a difference of 0.13%), Immigrants from Western Asia (2.6%, a difference of 0.15%), Mexican American Indian (2.6%, a difference of 0.24%), and Portuguese (2.6%, a difference of 0.32%).
| Demographics | Rating | Rank | Self-Care Disability |
| Marshallese | 1.2 /100 | #240 | Tragic 2.6% |
| Immigrants | Syria | 1.0 /100 | #241 | Tragic 2.6% |
| Spanish | 0.8 /100 | #242 | Tragic 2.6% |
| Hawaiians | 0.8 /100 | #243 | Tragic 2.6% |
| Yuman | 0.8 /100 | #244 | Tragic 2.6% |
| Immigrants | Western Asia | 0.6 /100 | #245 | Tragic 2.6% |
| Cheyenne | 0.6 /100 | #246 | Tragic 2.6% |
| Immigrants | Albania | 0.6 /100 | #247 | Tragic 2.6% |
| Nicaraguans | 0.6 /100 | #248 | Tragic 2.6% |
| Mexican American Indians | 0.5 /100 | #249 | Tragic 2.6% |
| Portuguese | 0.4 /100 | #250 | Tragic 2.6% |
| Immigrants | Liberia | 0.4 /100 | #251 | Tragic 2.6% |
| Immigrants | Bangladesh | 0.4 /100 | #252 | Tragic 2.6% |
| Immigrants | Haiti | 0.3 /100 | #253 | Tragic 2.6% |
| Haitians | 0.3 /100 | #254 | Tragic 2.6% |
Demographics Similar to Immigrants from Eritrea by Self-Care Disability
In terms of self-care disability, the demographic groups most similar to Immigrants from Eritrea are Tongan (2.2%, a difference of 0.080%), Immigrants from Taiwan (2.2%, a difference of 0.33%), Bulgarian (2.2%, a difference of 0.33%), Immigrants from Venezuela (2.2%, a difference of 0.36%), and Cambodian (2.2%, a difference of 0.58%).
| Demographics | Rating | Rank | Self-Care Disability |
| Immigrants | Ethiopia | 100.0 /100 | #12 | Exceptional 2.2% |
| Ethiopians | 100.0 /100 | #13 | Exceptional 2.2% |
| Luxembourgers | 100.0 /100 | #14 | Exceptional 2.2% |
| Okinawans | 100.0 /100 | #15 | Exceptional 2.2% |
| Immigrants | Kuwait | 100.0 /100 | #16 | Exceptional 2.2% |
| Immigrants | Saudi Arabia | 100.0 /100 | #17 | Exceptional 2.2% |
| Immigrants | Taiwan | 100.0 /100 | #18 | Exceptional 2.2% |
| Immigrants | Eritrea | 100.0 /100 | #19 | Exceptional 2.2% |
| Tongans | 100.0 /100 | #20 | Exceptional 2.2% |
| Bulgarians | 100.0 /100 | #21 | Exceptional 2.2% |
| Immigrants | Venezuela | 100.0 /100 | #22 | Exceptional 2.2% |
| Cambodians | 100.0 /100 | #23 | Exceptional 2.2% |
| Cypriots | 100.0 /100 | #24 | Exceptional 2.2% |
| Turks | 100.0 /100 | #25 | Exceptional 2.2% |
| Immigrants | Sri Lanka | 99.9 /100 | #26 | Exceptional 2.2% |