Immigrants from Africa vs Immigrants from North America Male Disability
COMPARE
Immigrants from Africa
Immigrants from North America
Male Disability
Male Disability Comparison
Immigrants from Africa
Immigrants from North America
10.9%
MALE DISABILITY
89.4/ 100
METRIC RATING
120th/ 347
METRIC RANK
11.9%
MALE DISABILITY
1.5/ 100
METRIC RATING
235th/ 347
METRIC RANK
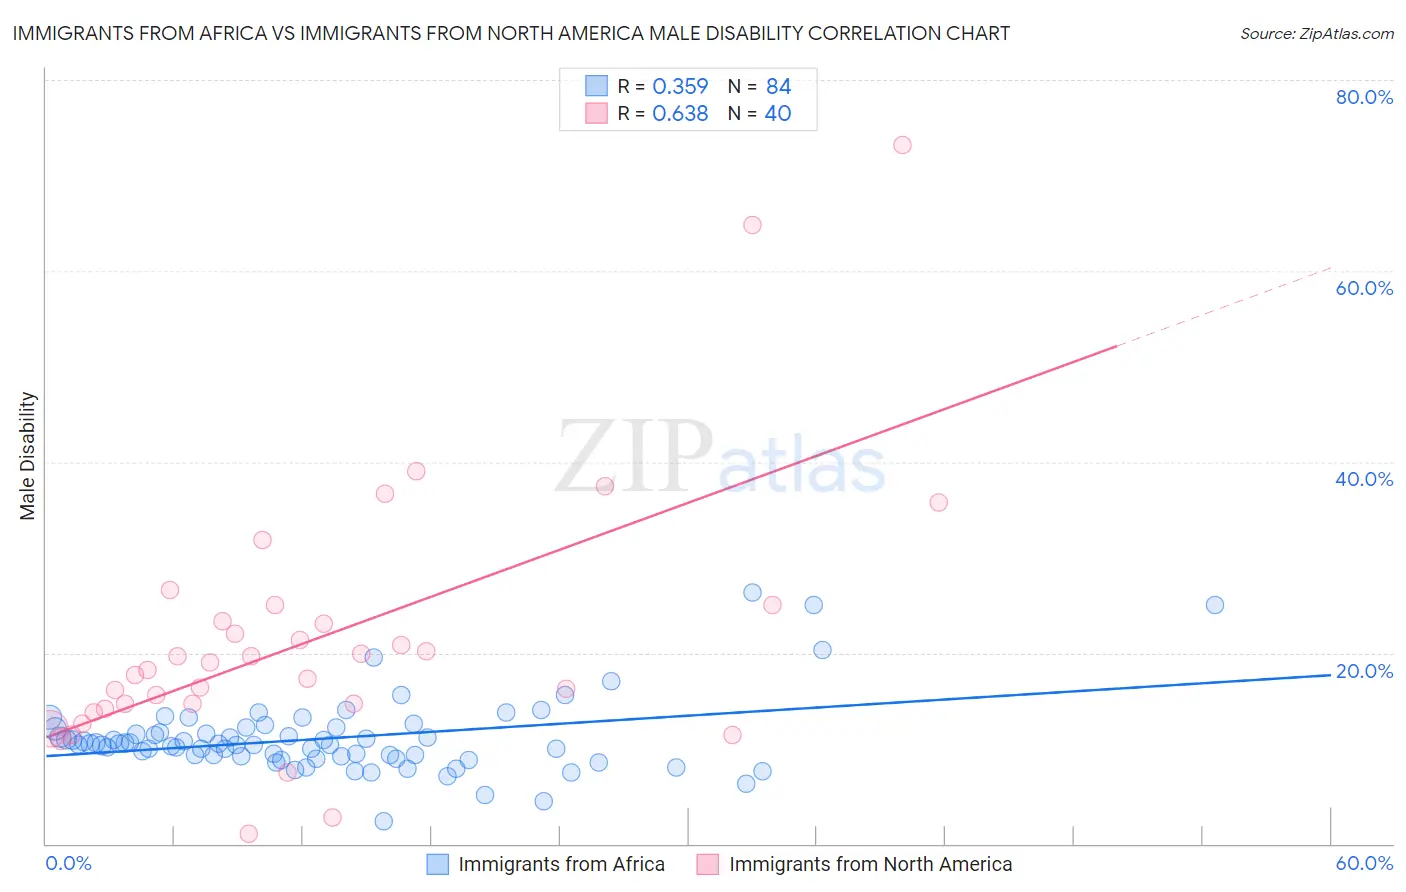
Immigrants from Africa vs Immigrants from North America Male Disability Correlation Chart
The statistical analysis conducted on geographies consisting of 469,296,283 people shows a mild positive correlation between the proportion of Immigrants from Africa and percentage of males with a disability in the United States with a correlation coefficient (R) of 0.359 and weighted average of 10.9%. Similarly, the statistical analysis conducted on geographies consisting of 462,399,243 people shows a significant positive correlation between the proportion of Immigrants from North America and percentage of males with a disability in the United States with a correlation coefficient (R) of 0.638 and weighted average of 11.9%, a difference of 9.0%.
Male Disability Correlation Summary
| Measurement | Immigrants from Africa | Immigrants from North America |
| Minimum | 2.4% | 1.0% |
| Maximum | 26.3% | 73.2% |
| Range | 23.9% | 72.2% |
| Mean | 11.0% | 21.6% |
| Median | 10.4% | 18.6% |
| Interquartile 25% (IQ1) | 9.1% | 14.4% |
| Interquartile 75% (IQ3) | 11.8% | 24.1% |
| Interquartile Range (IQR) | 2.7% | 9.8% |
| Standard Deviation (Sample) | 3.9% | 14.0% |
| Standard Deviation (Population) | 3.9% | 13.8% |
Similar Demographics by Male Disability
Demographics Similar to Immigrants from Africa by Male Disability
In terms of male disability, the demographic groups most similar to Immigrants from Africa are Immigrants from South Eastern Asia (10.9%, a difference of 0.040%), Immigrants from Ghana (10.9%, a difference of 0.060%), Immigrants from Cuba (10.9%, a difference of 0.11%), Armenian (10.9%, a difference of 0.11%), and Immigrants from Czechoslovakia (10.9%, a difference of 0.15%).
| Demographics | Rating | Rank | Male Disability |
| Immigrants | Zimbabwe | 93.0 /100 | #113 | Exceptional 10.8% |
| Central Americans | 92.7 /100 | #114 | Exceptional 10.8% |
| Immigrants | Barbados | 92.2 /100 | #115 | Exceptional 10.8% |
| Immigrants | South Africa | 91.8 /100 | #116 | Exceptional 10.8% |
| Eastern Europeans | 90.6 /100 | #117 | Exceptional 10.9% |
| Immigrants | Cuba | 90.2 /100 | #118 | Exceptional 10.9% |
| Armenians | 90.1 /100 | #119 | Exceptional 10.9% |
| Immigrants | Africa | 89.4 /100 | #120 | Excellent 10.9% |
| Immigrants | South Eastern Asia | 89.2 /100 | #121 | Excellent 10.9% |
| Immigrants | Ghana | 89.0 /100 | #122 | Excellent 10.9% |
| Immigrants | Czechoslovakia | 88.4 /100 | #123 | Excellent 10.9% |
| South American Indians | 88.1 /100 | #124 | Excellent 10.9% |
| Immigrants | North Macedonia | 88.1 /100 | #125 | Excellent 10.9% |
| Immigrants | Trinidad and Tobago | 86.9 /100 | #126 | Excellent 10.9% |
| Immigrants | Ukraine | 86.8 /100 | #127 | Excellent 10.9% |
Demographics Similar to Immigrants from North America by Male Disability
In terms of male disability, the demographic groups most similar to Immigrants from North America are Immigrants from Canada (11.9%, a difference of 0.13%), U.S. Virgin Islander (11.9%, a difference of 0.14%), Carpatho Rusyn (11.9%, a difference of 0.15%), Mexican (11.8%, a difference of 0.20%), and Malaysian (11.8%, a difference of 0.24%).
| Demographics | Rating | Rank | Male Disability |
| Hispanics or Latinos | 2.3 /100 | #228 | Tragic 11.8% |
| Bermudans | 2.3 /100 | #229 | Tragic 11.8% |
| Croatians | 2.1 /100 | #230 | Tragic 11.8% |
| Dominicans | 1.8 /100 | #231 | Tragic 11.8% |
| Malaysians | 1.8 /100 | #232 | Tragic 11.8% |
| Mexicans | 1.7 /100 | #233 | Tragic 11.8% |
| Immigrants | Canada | 1.6 /100 | #234 | Tragic 11.9% |
| Immigrants | North America | 1.5 /100 | #235 | Tragic 11.9% |
| U.S. Virgin Islanders | 1.3 /100 | #236 | Tragic 11.9% |
| Carpatho Rusyns | 1.3 /100 | #237 | Tragic 11.9% |
| Yugoslavians | 1.2 /100 | #238 | Tragic 11.9% |
| Italians | 1.2 /100 | #239 | Tragic 11.9% |
| Czechs | 1.1 /100 | #240 | Tragic 11.9% |
| Bahamians | 1.1 /100 | #241 | Tragic 11.9% |
| Northern Europeans | 1.1 /100 | #242 | Tragic 11.9% |