Icelander vs Hungarian Disability
COMPARE
Icelander
Hungarian
Disability
Disability Comparison
Icelanders
Hungarians
11.8%
DISABILITY
34.0/ 100
METRIC RATING
182nd/ 347
METRIC RANK
12.2%
DISABILITY
1.7/ 100
METRIC RATING
240th/ 347
METRIC RANK
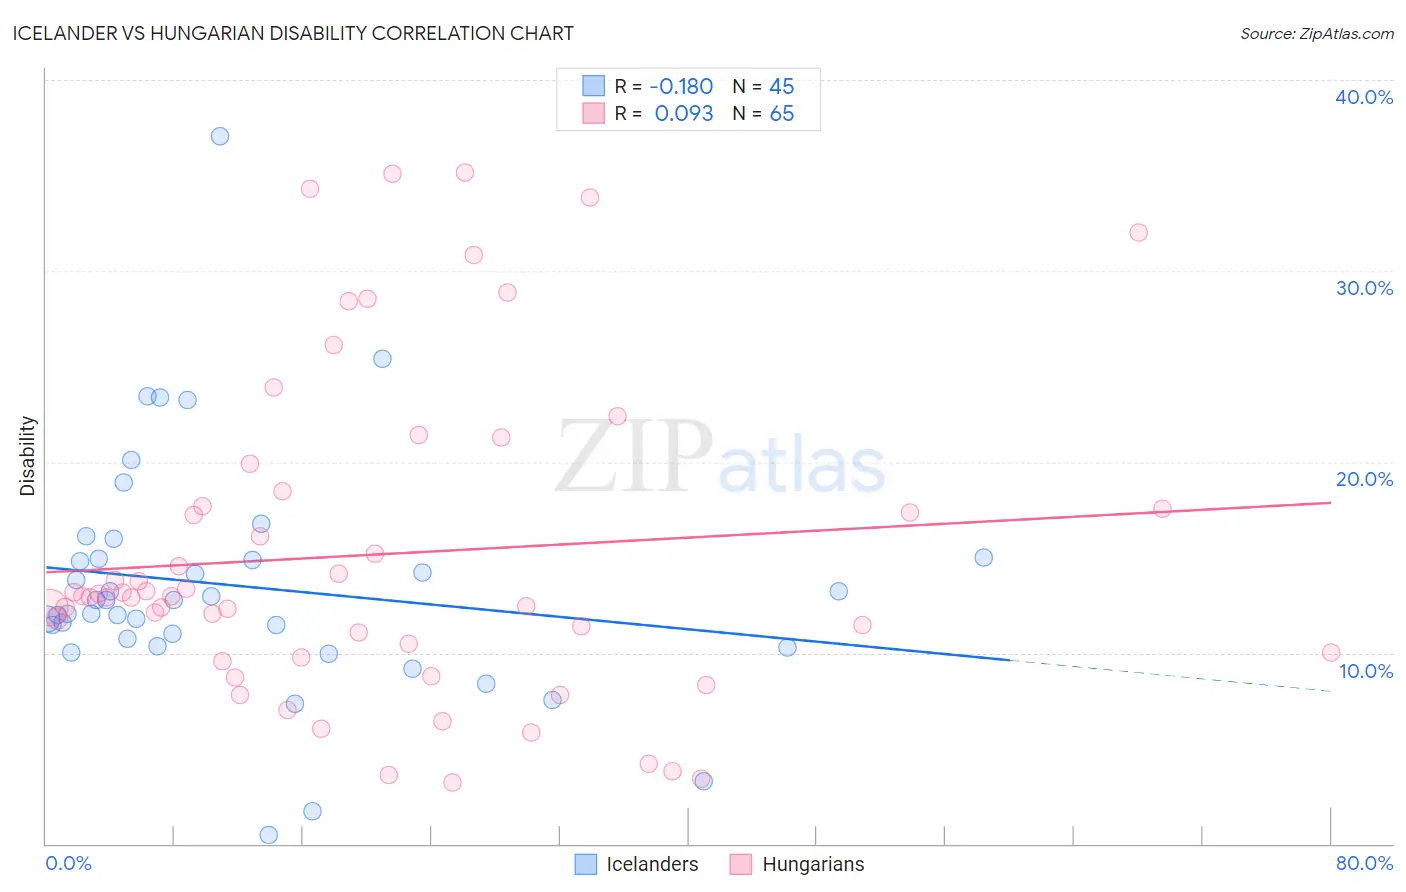
Icelander vs Hungarian Disability Correlation Chart
The statistical analysis conducted on geographies consisting of 159,644,692 people shows a poor negative correlation between the proportion of Icelanders and percentage of population with a disability in the United States with a correlation coefficient (R) of -0.180 and weighted average of 11.8%. Similarly, the statistical analysis conducted on geographies consisting of 486,180,390 people shows a slight positive correlation between the proportion of Hungarians and percentage of population with a disability in the United States with a correlation coefficient (R) of 0.093 and weighted average of 12.2%, a difference of 3.7%.
Disability Correlation Summary
| Measurement | Icelander | Hungarian |
| Minimum | 0.46% | 3.2% |
| Maximum | 37.1% | 35.2% |
| Range | 36.6% | 31.9% |
| Mean | 13.5% | 15.1% |
| Median | 12.7% | 12.9% |
| Interquartile 25% (IQ1) | 10.5% | 9.9% |
| Interquartile 75% (IQ3) | 15.0% | 18.1% |
| Interquartile Range (IQR) | 4.4% | 8.2% |
| Standard Deviation (Sample) | 6.2% | 8.3% |
| Standard Deviation (Population) | 6.2% | 8.3% |
Similar Demographics by Disability
Demographics Similar to Icelanders by Disability
In terms of disability, the demographic groups most similar to Icelanders are Immigrants from Oceania (11.8%, a difference of 0.010%), Honduran (11.8%, a difference of 0.14%), Immigrants from Honduras (11.8%, a difference of 0.19%), Iraqi (11.8%, a difference of 0.20%), and Immigrants from Burma/Myanmar (11.8%, a difference of 0.28%).
| Demographics | Rating | Rank | Disability |
| Haitians | 48.6 /100 | #175 | Average 11.7% |
| Immigrants | Western Africa | 47.5 /100 | #176 | Average 11.7% |
| Immigrants | Central America | 46.6 /100 | #177 | Average 11.7% |
| Greeks | 46.2 /100 | #178 | Average 11.7% |
| Immigrants | Armenia | 41.9 /100 | #179 | Average 11.7% |
| Immigrants | Honduras | 37.8 /100 | #180 | Fair 11.8% |
| Immigrants | Oceania | 34.3 /100 | #181 | Fair 11.8% |
| Icelanders | 34.0 /100 | #182 | Fair 11.8% |
| Hondurans | 31.2 /100 | #183 | Fair 11.8% |
| Iraqis | 30.0 /100 | #184 | Fair 11.8% |
| Immigrants | Burma/Myanmar | 28.5 /100 | #185 | Fair 11.8% |
| Immigrants | Scotland | 28.2 /100 | #186 | Fair 11.8% |
| Lebanese | 27.9 /100 | #187 | Fair 11.8% |
| Immigrants | Mexico | 23.8 /100 | #188 | Fair 11.9% |
| Immigrants | Zaire | 21.8 /100 | #189 | Fair 11.9% |
Demographics Similar to Hungarians by Disability
In terms of disability, the demographic groups most similar to Hungarians are Yugoslavian (12.2%, a difference of 0.0%), Polish (12.2%, a difference of 0.020%), Swedish (12.2%, a difference of 0.050%), Norwegian (12.2%, a difference of 0.090%), and British (12.2%, a difference of 0.11%).
| Demographics | Rating | Rank | Disability |
| Bahamians | 2.3 /100 | #233 | Tragic 12.2% |
| Japanese | 2.3 /100 | #234 | Tragic 12.2% |
| Yup'ik | 2.2 /100 | #235 | Tragic 12.2% |
| Chinese | 2.0 /100 | #236 | Tragic 12.2% |
| Immigrants | Congo | 1.9 /100 | #237 | Tragic 12.2% |
| Norwegians | 1.9 /100 | #238 | Tragic 12.2% |
| Swedes | 1.8 /100 | #239 | Tragic 12.2% |
| Hungarians | 1.7 /100 | #240 | Tragic 12.2% |
| Yugoslavians | 1.7 /100 | #241 | Tragic 12.2% |
| Poles | 1.7 /100 | #242 | Tragic 12.2% |
| British | 1.5 /100 | #243 | Tragic 12.2% |
| Basques | 1.5 /100 | #244 | Tragic 12.2% |
| Liberians | 1.5 /100 | #245 | Tragic 12.2% |
| Swiss | 1.5 /100 | #246 | Tragic 12.2% |
| Indonesians | 1.4 /100 | #247 | Tragic 12.2% |