Immigrants from Iraq vs Hungarian Disability
COMPARE
Immigrants from Iraq
Hungarian
Disability
Disability Comparison
Immigrants from Iraq
Hungarians
12.0%
DISABILITY
7.1/ 100
METRIC RATING
213th/ 347
METRIC RANK
12.2%
DISABILITY
1.7/ 100
METRIC RATING
240th/ 347
METRIC RANK
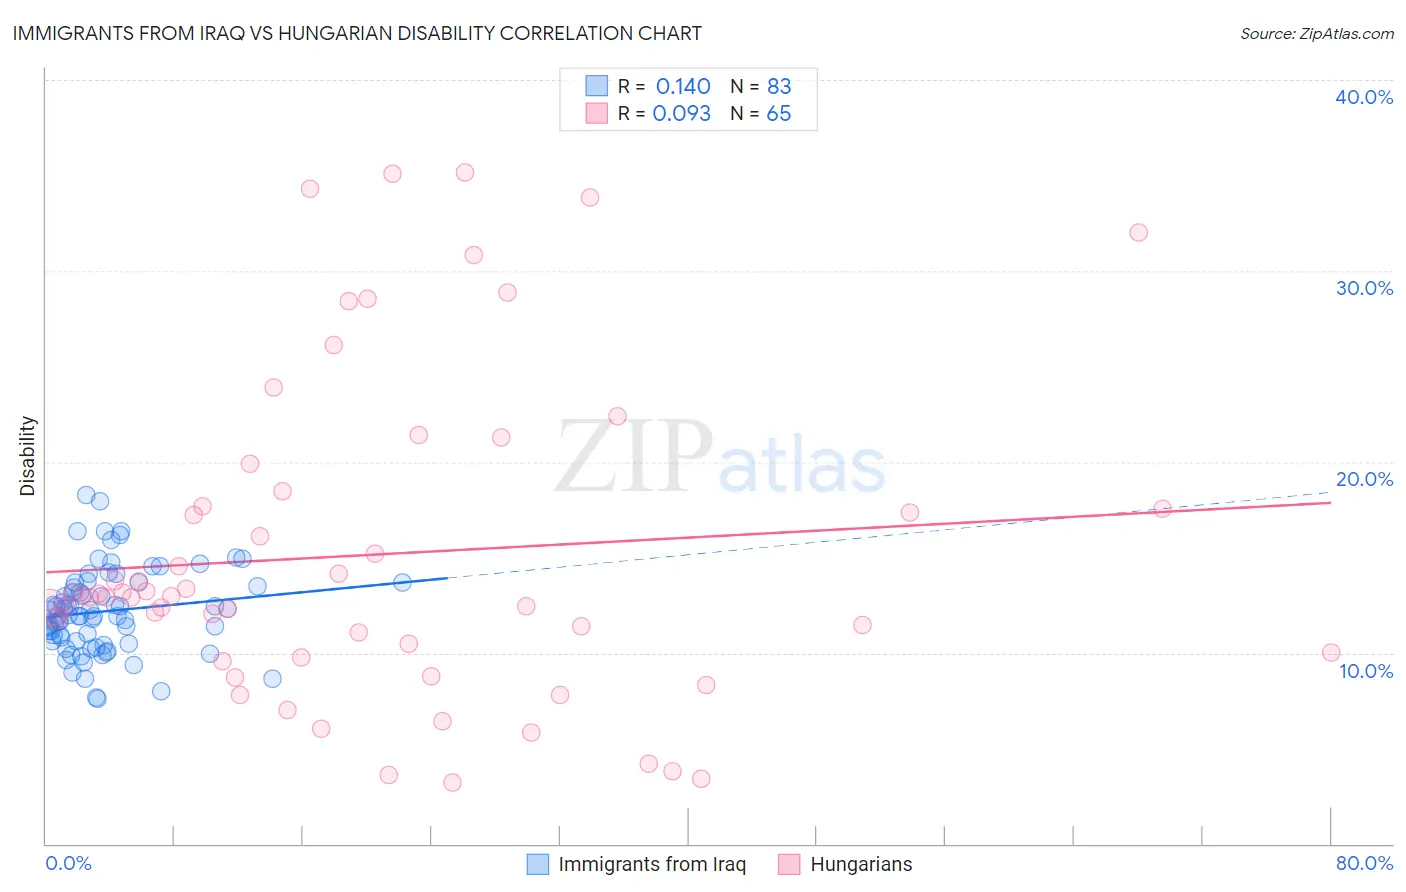
Immigrants from Iraq vs Hungarian Disability Correlation Chart
The statistical analysis conducted on geographies consisting of 194,773,815 people shows a poor positive correlation between the proportion of Immigrants from Iraq and percentage of population with a disability in the United States with a correlation coefficient (R) of 0.140 and weighted average of 12.0%. Similarly, the statistical analysis conducted on geographies consisting of 486,180,390 people shows a slight positive correlation between the proportion of Hungarians and percentage of population with a disability in the United States with a correlation coefficient (R) of 0.093 and weighted average of 12.2%, a difference of 1.6%.
Disability Correlation Summary
| Measurement | Immigrants from Iraq | Hungarian |
| Minimum | 7.6% | 3.2% |
| Maximum | 18.2% | 35.2% |
| Range | 10.7% | 31.9% |
| Mean | 12.2% | 15.1% |
| Median | 11.9% | 12.9% |
| Interquartile 25% (IQ1) | 10.6% | 9.9% |
| Interquartile 75% (IQ3) | 13.7% | 18.1% |
| Interquartile Range (IQR) | 3.1% | 8.2% |
| Standard Deviation (Sample) | 2.2% | 8.3% |
| Standard Deviation (Population) | 2.2% | 8.3% |
Similar Demographics by Disability
Demographics Similar to Immigrants from Iraq by Disability
In terms of disability, the demographic groups most similar to Immigrants from Iraq are Austrian (12.0%, a difference of 0.010%), Immigrants from Cambodia (12.0%, a difference of 0.030%), Immigrants from Somalia (12.0%, a difference of 0.050%), Czech (12.0%, a difference of 0.11%), and Immigrants from Canada (12.1%, a difference of 0.18%).
| Demographics | Rating | Rank | Disability |
| Immigrants | Senegal | 9.4 /100 | #206 | Tragic 12.0% |
| Immigrants | Thailand | 9.3 /100 | #207 | Tragic 12.0% |
| Immigrants | Caribbean | 9.1 /100 | #208 | Tragic 12.0% |
| Danes | 8.7 /100 | #209 | Tragic 12.0% |
| Czechs | 7.9 /100 | #210 | Tragic 12.0% |
| Immigrants | Cambodia | 7.3 /100 | #211 | Tragic 12.0% |
| Austrians | 7.2 /100 | #212 | Tragic 12.0% |
| Immigrants | Iraq | 7.1 /100 | #213 | Tragic 12.0% |
| Immigrants | Somalia | 6.8 /100 | #214 | Tragic 12.0% |
| Immigrants | Canada | 6.1 /100 | #215 | Tragic 12.1% |
| Panamanians | 5.4 /100 | #216 | Tragic 12.1% |
| Immigrants | North America | 5.3 /100 | #217 | Tragic 12.1% |
| Immigrants | Jamaica | 5.0 /100 | #218 | Tragic 12.1% |
| Croatians | 4.9 /100 | #219 | Tragic 12.1% |
| Immigrants | Bahamas | 4.7 /100 | #220 | Tragic 12.1% |
Demographics Similar to Hungarians by Disability
In terms of disability, the demographic groups most similar to Hungarians are Yugoslavian (12.2%, a difference of 0.0%), Polish (12.2%, a difference of 0.020%), Swedish (12.2%, a difference of 0.050%), Norwegian (12.2%, a difference of 0.090%), and British (12.2%, a difference of 0.11%).
| Demographics | Rating | Rank | Disability |
| Bahamians | 2.3 /100 | #233 | Tragic 12.2% |
| Japanese | 2.3 /100 | #234 | Tragic 12.2% |
| Yup'ik | 2.2 /100 | #235 | Tragic 12.2% |
| Chinese | 2.0 /100 | #236 | Tragic 12.2% |
| Immigrants | Congo | 1.9 /100 | #237 | Tragic 12.2% |
| Norwegians | 1.9 /100 | #238 | Tragic 12.2% |
| Swedes | 1.8 /100 | #239 | Tragic 12.2% |
| Hungarians | 1.7 /100 | #240 | Tragic 12.2% |
| Yugoslavians | 1.7 /100 | #241 | Tragic 12.2% |
| Poles | 1.7 /100 | #242 | Tragic 12.2% |
| British | 1.5 /100 | #243 | Tragic 12.2% |
| Basques | 1.5 /100 | #244 | Tragic 12.2% |
| Liberians | 1.5 /100 | #245 | Tragic 12.2% |
| Swiss | 1.5 /100 | #246 | Tragic 12.2% |
| Indonesians | 1.4 /100 | #247 | Tragic 12.2% |