Icelander vs Immigrants from Belize Child Poverty Under the Age of 16
COMPARE
Icelander
Immigrants from Belize
Child Poverty Under the Age of 16
Child Poverty Under the Age of 16 Comparison
Icelanders
Immigrants from Belize
15.4%
CHILD POVERTY UNDER THE AGE OF 16
82.5/ 100
METRIC RATING
143rd/ 347
METRIC RANK
20.3%
CHILD POVERTY UNDER THE AGE OF 16
0.0/ 100
METRIC RATING
288th/ 347
METRIC RANK
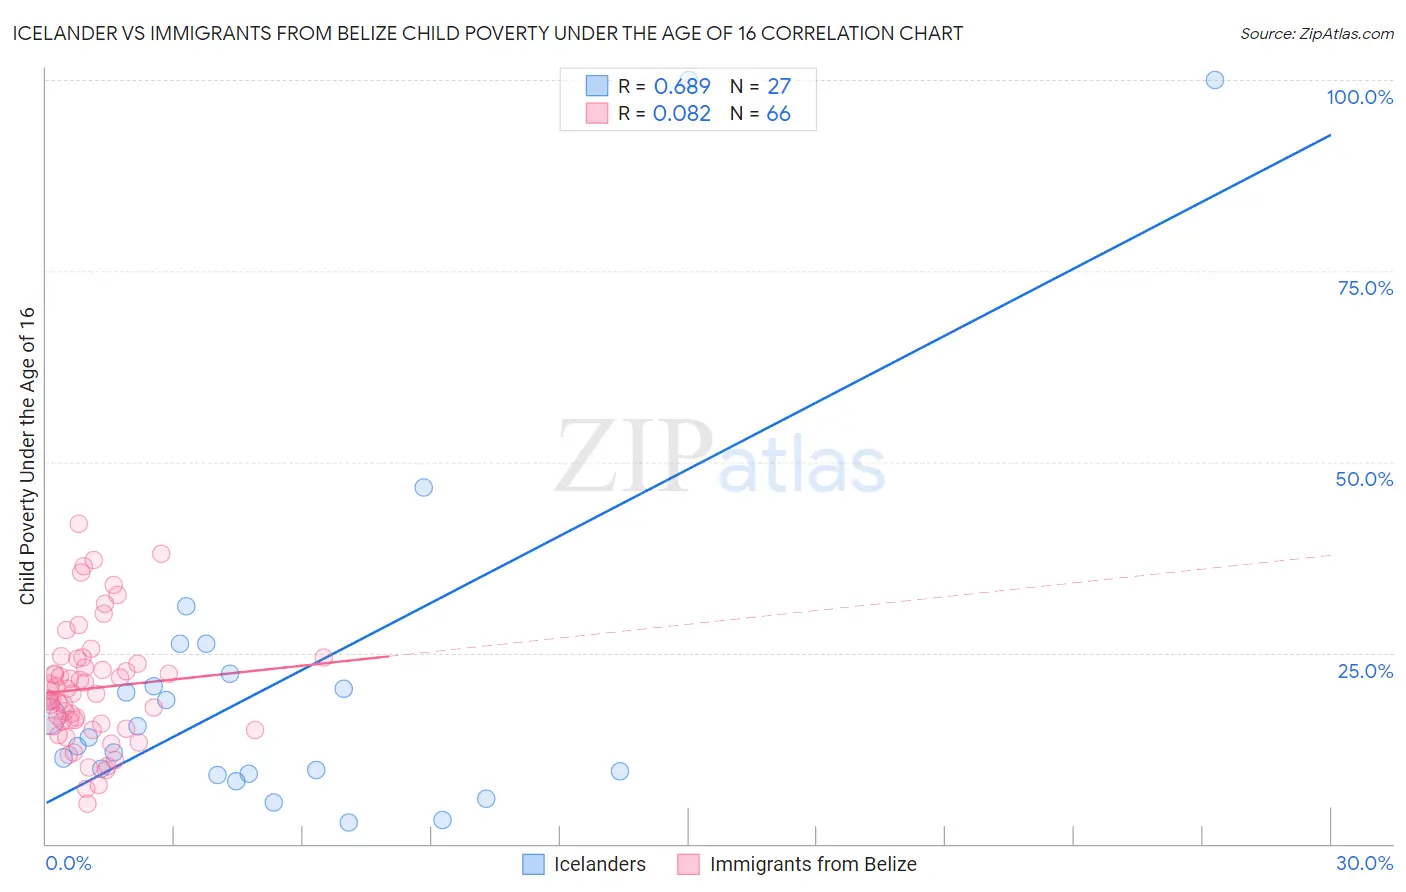
Icelander vs Immigrants from Belize Child Poverty Under the Age of 16 Correlation Chart
The statistical analysis conducted on geographies consisting of 158,777,342 people shows a significant positive correlation between the proportion of Icelanders and poverty level among children under the age of 16 in the United States with a correlation coefficient (R) of 0.689 and weighted average of 15.4%. Similarly, the statistical analysis conducted on geographies consisting of 130,133,113 people shows a slight positive correlation between the proportion of Immigrants from Belize and poverty level among children under the age of 16 in the United States with a correlation coefficient (R) of 0.082 and weighted average of 20.3%, a difference of 31.4%.
Child Poverty Under the Age of 16 Correlation Summary
| Measurement | Icelander | Immigrants from Belize |
| Minimum | 2.9% | 5.2% |
| Maximum | 100.0% | 41.9% |
| Range | 97.1% | 36.7% |
| Mean | 21.7% | 20.4% |
| Median | 14.0% | 19.6% |
| Interquartile 25% (IQ1) | 9.1% | 15.4% |
| Interquartile 75% (IQ3) | 22.2% | 23.5% |
| Interquartile Range (IQR) | 13.1% | 8.1% |
| Standard Deviation (Sample) | 24.5% | 7.8% |
| Standard Deviation (Population) | 24.0% | 7.7% |
Similar Demographics by Child Poverty Under the Age of 16
Demographics Similar to Icelanders by Child Poverty Under the Age of 16
In terms of child poverty under the age of 16, the demographic groups most similar to Icelanders are Brazilian (15.4%, a difference of 0.070%), Immigrants from Hungary (15.5%, a difference of 0.12%), Immigrants from Peru (15.5%, a difference of 0.17%), Slovak (15.5%, a difference of 0.21%), and Slavic (15.4%, a difference of 0.41%).
| Demographics | Rating | Rank | Child Poverty Under the Age of 16 |
| Immigrants | Spain | 87.3 /100 | #136 | Excellent 15.3% |
| Peruvians | 87.2 /100 | #137 | Excellent 15.3% |
| Welsh | 87.2 /100 | #138 | Excellent 15.3% |
| Immigrants | Vietnam | 87.1 /100 | #139 | Excellent 15.3% |
| New Zealanders | 86.9 /100 | #140 | Excellent 15.3% |
| Slavs | 84.2 /100 | #141 | Excellent 15.4% |
| Brazilians | 82.8 /100 | #142 | Excellent 15.4% |
| Icelanders | 82.5 /100 | #143 | Excellent 15.4% |
| Immigrants | Hungary | 81.9 /100 | #144 | Excellent 15.5% |
| Immigrants | Peru | 81.7 /100 | #145 | Excellent 15.5% |
| Slovaks | 81.4 /100 | #146 | Excellent 15.5% |
| Immigrants | Kuwait | 80.5 /100 | #147 | Excellent 15.5% |
| Puget Sound Salish | 80.3 /100 | #148 | Excellent 15.5% |
| Israelis | 80.1 /100 | #149 | Excellent 15.5% |
| Immigrants | Jordan | 78.5 /100 | #150 | Good 15.6% |
Demographics Similar to Immigrants from Belize by Child Poverty Under the Age of 16
In terms of child poverty under the age of 16, the demographic groups most similar to Immigrants from Belize are Senegalese (20.4%, a difference of 0.24%), Yaqui (20.4%, a difference of 0.28%), Blackfeet (20.2%, a difference of 0.59%), Immigrants from West Indies (20.2%, a difference of 0.71%), and Immigrants from St. Vincent and the Grenadines (20.1%, a difference of 0.85%).
| Demographics | Rating | Rank | Child Poverty Under the Age of 16 |
| Central Americans | 0.0 /100 | #281 | Tragic 20.0% |
| Barbadians | 0.0 /100 | #282 | Tragic 20.0% |
| Immigrants | Zaire | 0.0 /100 | #283 | Tragic 20.1% |
| West Indians | 0.0 /100 | #284 | Tragic 20.1% |
| Immigrants | St. Vincent and the Grenadines | 0.0 /100 | #285 | Tragic 20.1% |
| Immigrants | West Indies | 0.0 /100 | #286 | Tragic 20.2% |
| Blackfeet | 0.0 /100 | #287 | Tragic 20.2% |
| Immigrants | Belize | 0.0 /100 | #288 | Tragic 20.3% |
| Senegalese | 0.0 /100 | #289 | Tragic 20.4% |
| Yaqui | 0.0 /100 | #290 | Tragic 20.4% |
| Chippewa | 0.0 /100 | #291 | Tragic 20.5% |
| Immigrants | Latin America | 0.0 /100 | #292 | Tragic 20.5% |
| Immigrants | Senegal | 0.0 /100 | #293 | Tragic 20.6% |
| Haitians | 0.0 /100 | #294 | Tragic 20.7% |
| Mexicans | 0.0 /100 | #295 | Tragic 20.7% |