Houma vs Mexican Ambulatory Disability
COMPARE
Houma
Mexican
Ambulatory Disability
Ambulatory Disability Comparison
Houma
Mexicans
9.3%
AMBULATORY DISABILITY
0.0/ 100
METRIC RATING
346th/ 347
METRIC RANK
6.4%
AMBULATORY DISABILITY
3.5/ 100
METRIC RATING
230th/ 347
METRIC RANK
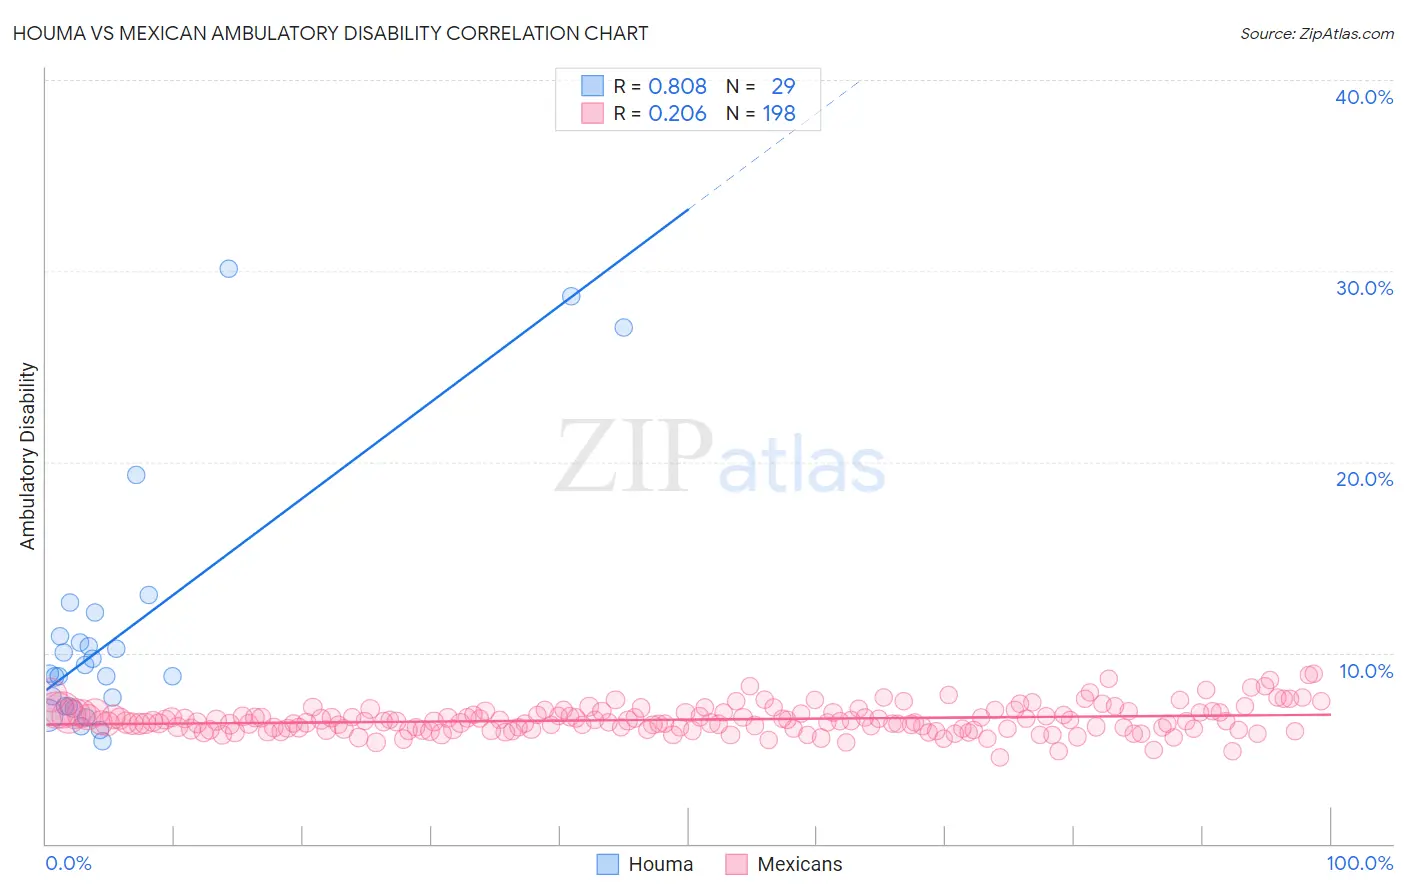
Houma vs Mexican Ambulatory Disability Correlation Chart
The statistical analysis conducted on geographies consisting of 36,798,241 people shows a very strong positive correlation between the proportion of Houma and percentage of population with ambulatory disability in the United States with a correlation coefficient (R) of 0.808 and weighted average of 9.3%. Similarly, the statistical analysis conducted on geographies consisting of 564,662,817 people shows a weak positive correlation between the proportion of Mexicans and percentage of population with ambulatory disability in the United States with a correlation coefficient (R) of 0.206 and weighted average of 6.4%, a difference of 45.7%.
Ambulatory Disability Correlation Summary
| Measurement | Houma | Mexican |
| Minimum | 5.4% | 4.5% |
| Maximum | 30.1% | 8.9% |
| Range | 24.8% | 4.4% |
| Mean | 11.2% | 6.5% |
| Median | 8.9% | 6.4% |
| Interquartile 25% (IQ1) | 7.2% | 6.0% |
| Interquartile 75% (IQ3) | 11.5% | 6.9% |
| Interquartile Range (IQR) | 4.3% | 0.88% |
| Standard Deviation (Sample) | 6.6% | 0.72% |
| Standard Deviation (Population) | 6.5% | 0.72% |
Similar Demographics by Ambulatory Disability
Demographics Similar to Houma by Ambulatory Disability
In terms of ambulatory disability, the demographic groups most similar to Houma are Lumbee (9.5%, a difference of 2.5%), Puerto Rican (8.9%, a difference of 4.9%), Tsimshian (8.8%, a difference of 5.5%), Tohono O'odham (8.7%, a difference of 6.5%), and Kiowa (8.6%, a difference of 8.1%).
| Demographics | Rating | Rank | Ambulatory Disability |
| Cherokee | 0.0 /100 | #333 | Tragic 7.9% |
| Yuman | 0.0 /100 | #334 | Tragic 7.9% |
| Chickasaw | 0.0 /100 | #335 | Tragic 8.0% |
| Seminole | 0.0 /100 | #336 | Tragic 8.0% |
| Dutch West Indians | 0.0 /100 | #337 | Tragic 8.2% |
| Colville | 0.0 /100 | #338 | Tragic 8.2% |
| Pima | 0.0 /100 | #339 | Tragic 8.2% |
| Choctaw | 0.0 /100 | #340 | Tragic 8.3% |
| Creek | 0.0 /100 | #341 | Tragic 8.5% |
| Kiowa | 0.0 /100 | #342 | Tragic 8.6% |
| Tohono O'odham | 0.0 /100 | #343 | Tragic 8.7% |
| Tsimshian | 0.0 /100 | #344 | Tragic 8.8% |
| Puerto Ricans | 0.0 /100 | #345 | Tragic 8.9% |
| Houma | 0.0 /100 | #346 | Tragic 9.3% |
| Lumbee | 0.0 /100 | #347 | Tragic 9.5% |
Demographics Similar to Mexicans by Ambulatory Disability
In terms of ambulatory disability, the demographic groups most similar to Mexicans are Czechoslovakian (6.4%, a difference of 0.11%), Portuguese (6.4%, a difference of 0.15%), Panamanian (6.4%, a difference of 0.16%), Cuban (6.4%, a difference of 0.17%), and Slavic (6.4%, a difference of 0.49%).
| Demographics | Rating | Rank | Ambulatory Disability |
| Immigrants | Honduras | 7.6 /100 | #223 | Tragic 6.3% |
| Liberians | 7.1 /100 | #224 | Tragic 6.3% |
| Hondurans | 6.3 /100 | #225 | Tragic 6.3% |
| Slavs | 5.1 /100 | #226 | Tragic 6.4% |
| Cubans | 4.0 /100 | #227 | Tragic 6.4% |
| Portuguese | 4.0 /100 | #228 | Tragic 6.4% |
| Czechoslovakians | 3.8 /100 | #229 | Tragic 6.4% |
| Mexicans | 3.5 /100 | #230 | Tragic 6.4% |
| Panamanians | 3.1 /100 | #231 | Tragic 6.4% |
| Assyrians/Chaldeans/Syriacs | 2.4 /100 | #232 | Tragic 6.4% |
| Sub-Saharan Africans | 2.3 /100 | #233 | Tragic 6.4% |
| Immigrants | Liberia | 2.3 /100 | #234 | Tragic 6.4% |
| Hispanics or Latinos | 2.2 /100 | #235 | Tragic 6.4% |
| Dutch | 2.0 /100 | #236 | Tragic 6.4% |
| Immigrants | Germany | 1.8 /100 | #237 | Tragic 6.4% |