Hopi vs Immigrants from Senegal Cognitive Disability
COMPARE
Hopi
Immigrants from Senegal
Cognitive Disability
Cognitive Disability Comparison
Hopi
Immigrants from Senegal
17.9%
COGNITIVE DISABILITY
0.6/ 100
METRIC RATING
253rd/ 347
METRIC RANK
18.7%
COGNITIVE DISABILITY
0.0/ 100
METRIC RATING
326th/ 347
METRIC RANK
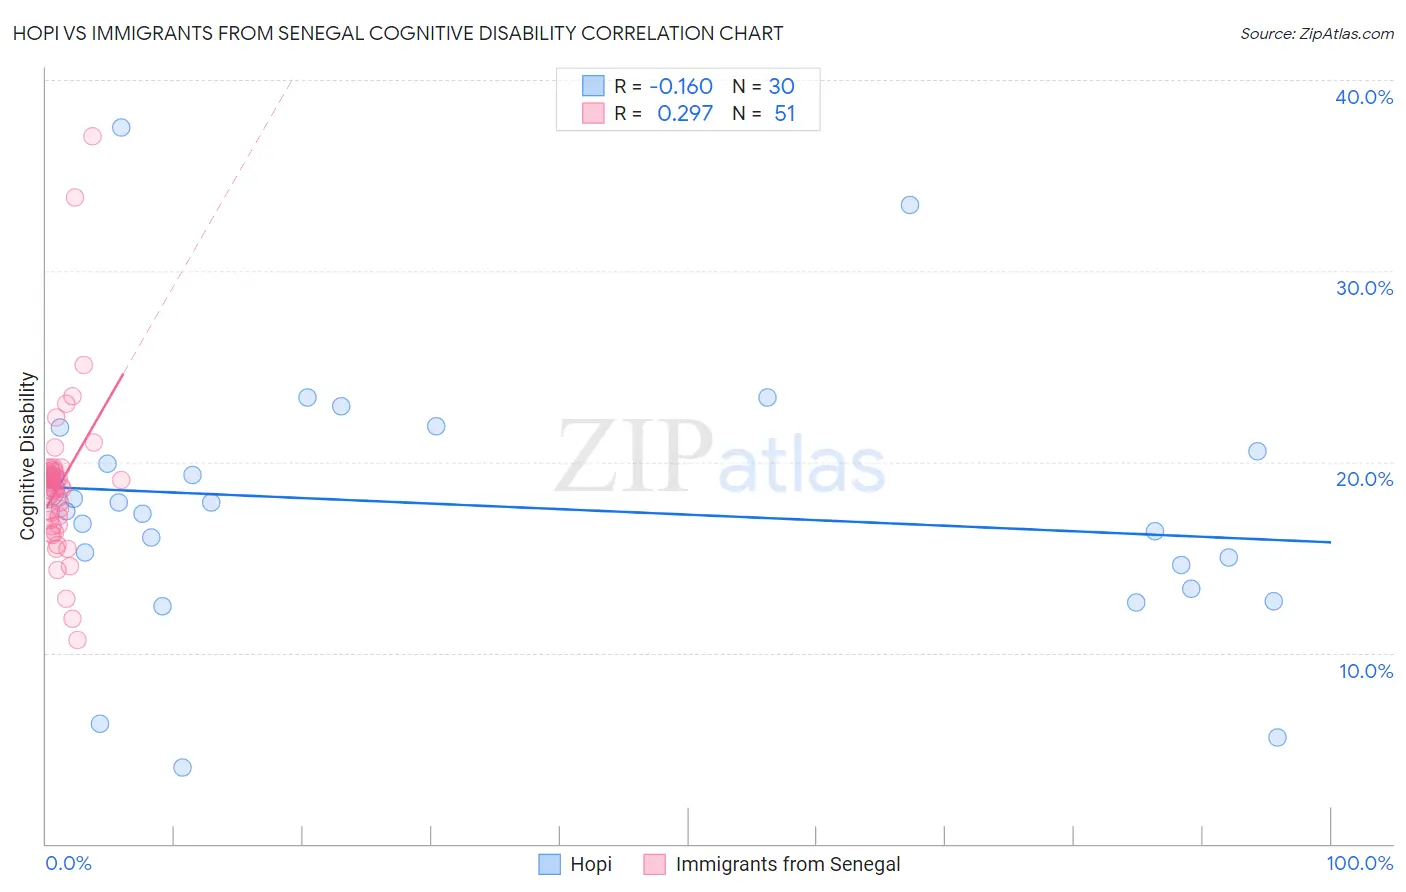
Hopi vs Immigrants from Senegal Cognitive Disability Correlation Chart
The statistical analysis conducted on geographies consisting of 74,733,532 people shows a poor negative correlation between the proportion of Hopi and percentage of population with cognitive disability in the United States with a correlation coefficient (R) of -0.160 and weighted average of 17.9%. Similarly, the statistical analysis conducted on geographies consisting of 90,129,295 people shows a weak positive correlation between the proportion of Immigrants from Senegal and percentage of population with cognitive disability in the United States with a correlation coefficient (R) of 0.297 and weighted average of 18.7%, a difference of 4.4%.
Cognitive Disability Correlation Summary
| Measurement | Hopi | Immigrants from Senegal |
| Minimum | 4.0% | 10.7% |
| Maximum | 37.5% | 37.0% |
| Range | 33.5% | 26.4% |
| Mean | 17.7% | 18.8% |
| Median | 17.6% | 18.6% |
| Interquartile 25% (IQ1) | 14.6% | 16.7% |
| Interquartile 75% (IQ3) | 20.5% | 19.5% |
| Interquartile Range (IQR) | 6.0% | 2.8% |
| Standard Deviation (Sample) | 6.9% | 4.3% |
| Standard Deviation (Population) | 6.8% | 4.3% |
Similar Demographics by Cognitive Disability
Demographics Similar to Hopi by Cognitive Disability
In terms of cognitive disability, the demographic groups most similar to Hopi are Hispanic or Latino (17.9%, a difference of 0.0%), Immigrants from Grenada (17.9%, a difference of 0.010%), Immigrants from the Azores (17.9%, a difference of 0.010%), Bahamian (17.9%, a difference of 0.010%), and Cree (17.9%, a difference of 0.030%).
| Demographics | Rating | Rank | Cognitive Disability |
| Immigrants | Thailand | 0.8 /100 | #246 | Tragic 17.9% |
| Samoans | 0.7 /100 | #247 | Tragic 17.9% |
| French American Indians | 0.7 /100 | #248 | Tragic 17.9% |
| Cree | 0.7 /100 | #249 | Tragic 17.9% |
| Immigrants | Ethiopia | 0.7 /100 | #250 | Tragic 17.9% |
| Malaysians | 0.6 /100 | #251 | Tragic 17.9% |
| Immigrants | Grenada | 0.6 /100 | #252 | Tragic 17.9% |
| Hopi | 0.6 /100 | #253 | Tragic 17.9% |
| Hispanics or Latinos | 0.6 /100 | #254 | Tragic 17.9% |
| Immigrants | Azores | 0.6 /100 | #255 | Tragic 17.9% |
| Bahamians | 0.6 /100 | #256 | Tragic 17.9% |
| Mexican American Indians | 0.6 /100 | #257 | Tragic 17.9% |
| Immigrants | Armenia | 0.6 /100 | #258 | Tragic 17.9% |
| Ethiopians | 0.5 /100 | #259 | Tragic 17.9% |
| Immigrants | Belize | 0.5 /100 | #260 | Tragic 17.9% |
Demographics Similar to Immigrants from Senegal by Cognitive Disability
In terms of cognitive disability, the demographic groups most similar to Immigrants from Senegal are Indonesian (18.7%, a difference of 0.020%), U.S. Virgin Islander (18.7%, a difference of 0.040%), Dominican (18.7%, a difference of 0.10%), Kiowa (18.7%, a difference of 0.10%), and Pueblo (18.7%, a difference of 0.22%).
| Demographics | Rating | Rank | Cognitive Disability |
| Comanche | 0.0 /100 | #319 | Tragic 18.6% |
| Apache | 0.0 /100 | #320 | Tragic 18.6% |
| Africans | 0.0 /100 | #321 | Tragic 18.6% |
| Immigrants | Liberia | 0.0 /100 | #322 | Tragic 18.7% |
| Pueblo | 0.0 /100 | #323 | Tragic 18.7% |
| Dominicans | 0.0 /100 | #324 | Tragic 18.7% |
| Indonesians | 0.0 /100 | #325 | Tragic 18.7% |
| Immigrants | Senegal | 0.0 /100 | #326 | Tragic 18.7% |
| U.S. Virgin Islanders | 0.0 /100 | #327 | Tragic 18.7% |
| Kiowa | 0.0 /100 | #328 | Tragic 18.7% |
| Navajo | 0.0 /100 | #329 | Tragic 18.8% |
| Immigrants | Dominican Republic | 0.0 /100 | #330 | Tragic 18.8% |
| Pima | 0.0 /100 | #331 | Tragic 18.8% |
| Immigrants | Sudan | 0.0 /100 | #332 | Tragic 18.8% |
| Immigrants | Yemen | 0.0 /100 | #333 | Tragic 18.8% |