Hopi vs Arapaho Cognitive Disability
COMPARE
Hopi
Arapaho
Cognitive Disability
Cognitive Disability Comparison
Hopi
Arapaho
17.9%
COGNITIVE DISABILITY
0.6/ 100
METRIC RATING
253rd/ 347
METRIC RANK
16.8%
COGNITIVE DISABILITY
97.3/ 100
METRIC RATING
110th/ 347
METRIC RANK
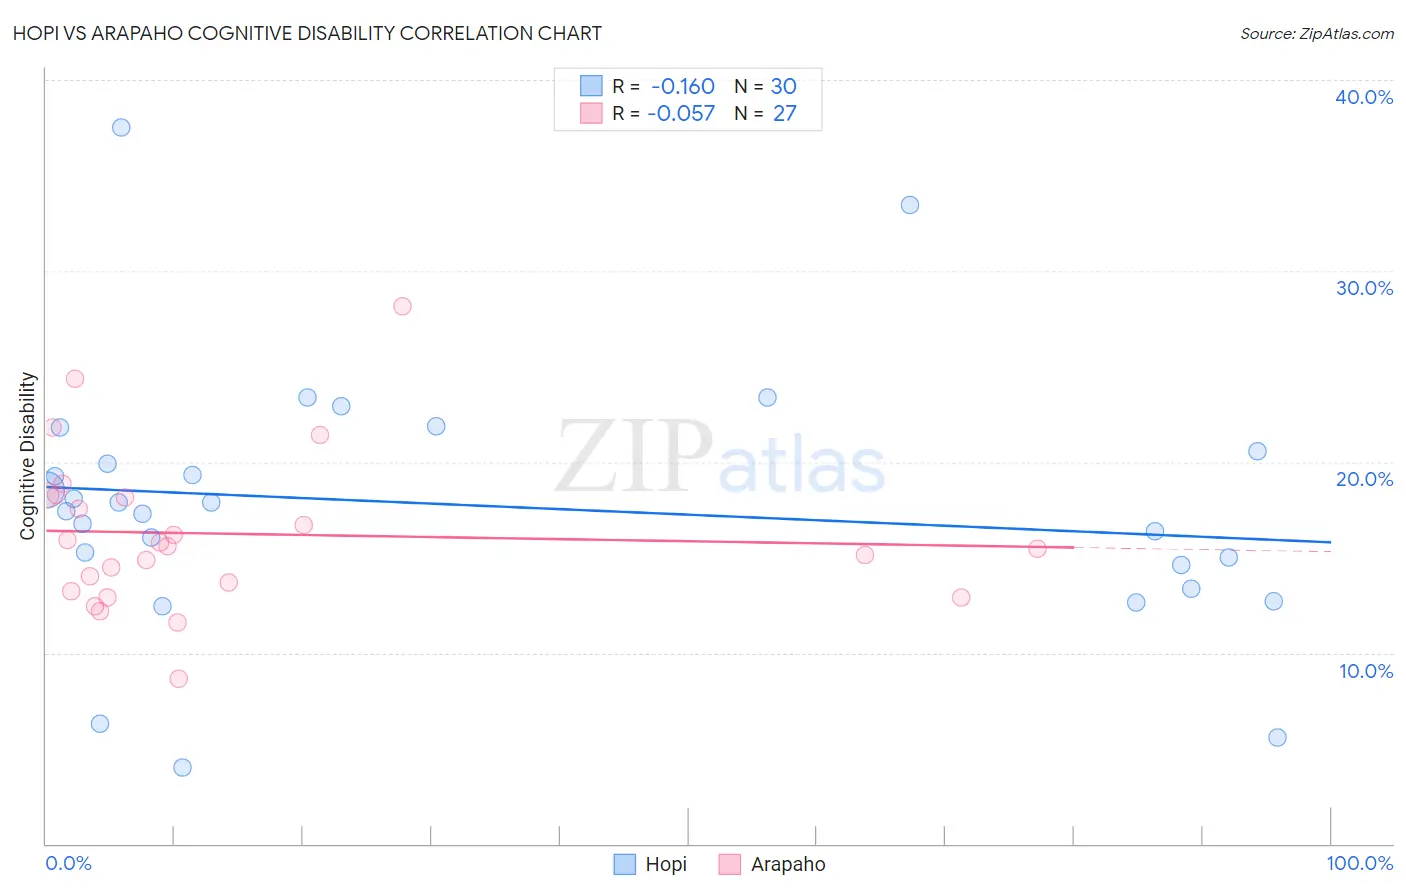
Hopi vs Arapaho Cognitive Disability Correlation Chart
The statistical analysis conducted on geographies consisting of 74,733,532 people shows a poor negative correlation between the proportion of Hopi and percentage of population with cognitive disability in the United States with a correlation coefficient (R) of -0.160 and weighted average of 17.9%. Similarly, the statistical analysis conducted on geographies consisting of 29,780,325 people shows a slight negative correlation between the proportion of Arapaho and percentage of population with cognitive disability in the United States with a correlation coefficient (R) of -0.057 and weighted average of 16.8%, a difference of 6.3%.
Cognitive Disability Correlation Summary
| Measurement | Hopi | Arapaho |
| Minimum | 4.0% | 8.6% |
| Maximum | 37.5% | 28.2% |
| Range | 33.5% | 19.5% |
| Mean | 17.7% | 16.2% |
| Median | 17.6% | 15.6% |
| Interquartile 25% (IQ1) | 14.6% | 13.2% |
| Interquartile 75% (IQ3) | 20.5% | 18.3% |
| Interquartile Range (IQR) | 6.0% | 5.0% |
| Standard Deviation (Sample) | 6.9% | 4.1% |
| Standard Deviation (Population) | 6.8% | 4.1% |
Similar Demographics by Cognitive Disability
Demographics Similar to Hopi by Cognitive Disability
In terms of cognitive disability, the demographic groups most similar to Hopi are Hispanic or Latino (17.9%, a difference of 0.0%), Immigrants from Grenada (17.9%, a difference of 0.010%), Immigrants from the Azores (17.9%, a difference of 0.010%), Bahamian (17.9%, a difference of 0.010%), and Cree (17.9%, a difference of 0.030%).
| Demographics | Rating | Rank | Cognitive Disability |
| Immigrants | Thailand | 0.8 /100 | #246 | Tragic 17.9% |
| Samoans | 0.7 /100 | #247 | Tragic 17.9% |
| French American Indians | 0.7 /100 | #248 | Tragic 17.9% |
| Cree | 0.7 /100 | #249 | Tragic 17.9% |
| Immigrants | Ethiopia | 0.7 /100 | #250 | Tragic 17.9% |
| Malaysians | 0.6 /100 | #251 | Tragic 17.9% |
| Immigrants | Grenada | 0.6 /100 | #252 | Tragic 17.9% |
| Hopi | 0.6 /100 | #253 | Tragic 17.9% |
| Hispanics or Latinos | 0.6 /100 | #254 | Tragic 17.9% |
| Immigrants | Azores | 0.6 /100 | #255 | Tragic 17.9% |
| Bahamians | 0.6 /100 | #256 | Tragic 17.9% |
| Mexican American Indians | 0.6 /100 | #257 | Tragic 17.9% |
| Immigrants | Armenia | 0.6 /100 | #258 | Tragic 17.9% |
| Ethiopians | 0.5 /100 | #259 | Tragic 17.9% |
| Immigrants | Belize | 0.5 /100 | #260 | Tragic 17.9% |
Demographics Similar to Arapaho by Cognitive Disability
In terms of cognitive disability, the demographic groups most similar to Arapaho are Albanian (16.8%, a difference of 0.010%), Uruguayan (16.8%, a difference of 0.010%), Indian (Asian) (16.8%, a difference of 0.040%), Immigrants from Sri Lanka (16.8%, a difference of 0.040%), and Korean (16.8%, a difference of 0.040%).
| Demographics | Rating | Rank | Cognitive Disability |
| Paraguayans | 98.0 /100 | #103 | Exceptional 16.8% |
| Palestinians | 98.0 /100 | #104 | Exceptional 16.8% |
| Immigrants | Eastern Asia | 97.9 /100 | #105 | Exceptional 16.8% |
| Northern Europeans | 97.8 /100 | #106 | Exceptional 16.8% |
| Immigrants | Nicaragua | 97.8 /100 | #107 | Exceptional 16.8% |
| Canadians | 97.5 /100 | #108 | Exceptional 16.8% |
| Albanians | 97.3 /100 | #109 | Exceptional 16.8% |
| Arapaho | 97.3 /100 | #110 | Exceptional 16.8% |
| Uruguayans | 97.2 /100 | #111 | Exceptional 16.8% |
| Indians (Asian) | 97.2 /100 | #112 | Exceptional 16.8% |
| Immigrants | Sri Lanka | 97.1 /100 | #113 | Exceptional 16.8% |
| Koreans | 97.1 /100 | #114 | Exceptional 16.8% |
| Yup'ik | 96.9 /100 | #115 | Exceptional 16.9% |
| Inupiat | 96.5 /100 | #116 | Exceptional 16.9% |
| Immigrants | Japan | 96.2 /100 | #117 | Exceptional 16.9% |