Hopi vs Alaska Native Cognitive Disability
COMPARE
Hopi
Alaska Native
Cognitive Disability
Cognitive Disability Comparison
Hopi
Alaska Natives
17.9%
COGNITIVE DISABILITY
0.6/ 100
METRIC RATING
253rd/ 347
METRIC RANK
17.5%
COGNITIVE DISABILITY
10.4/ 100
METRIC RATING
206th/ 347
METRIC RANK
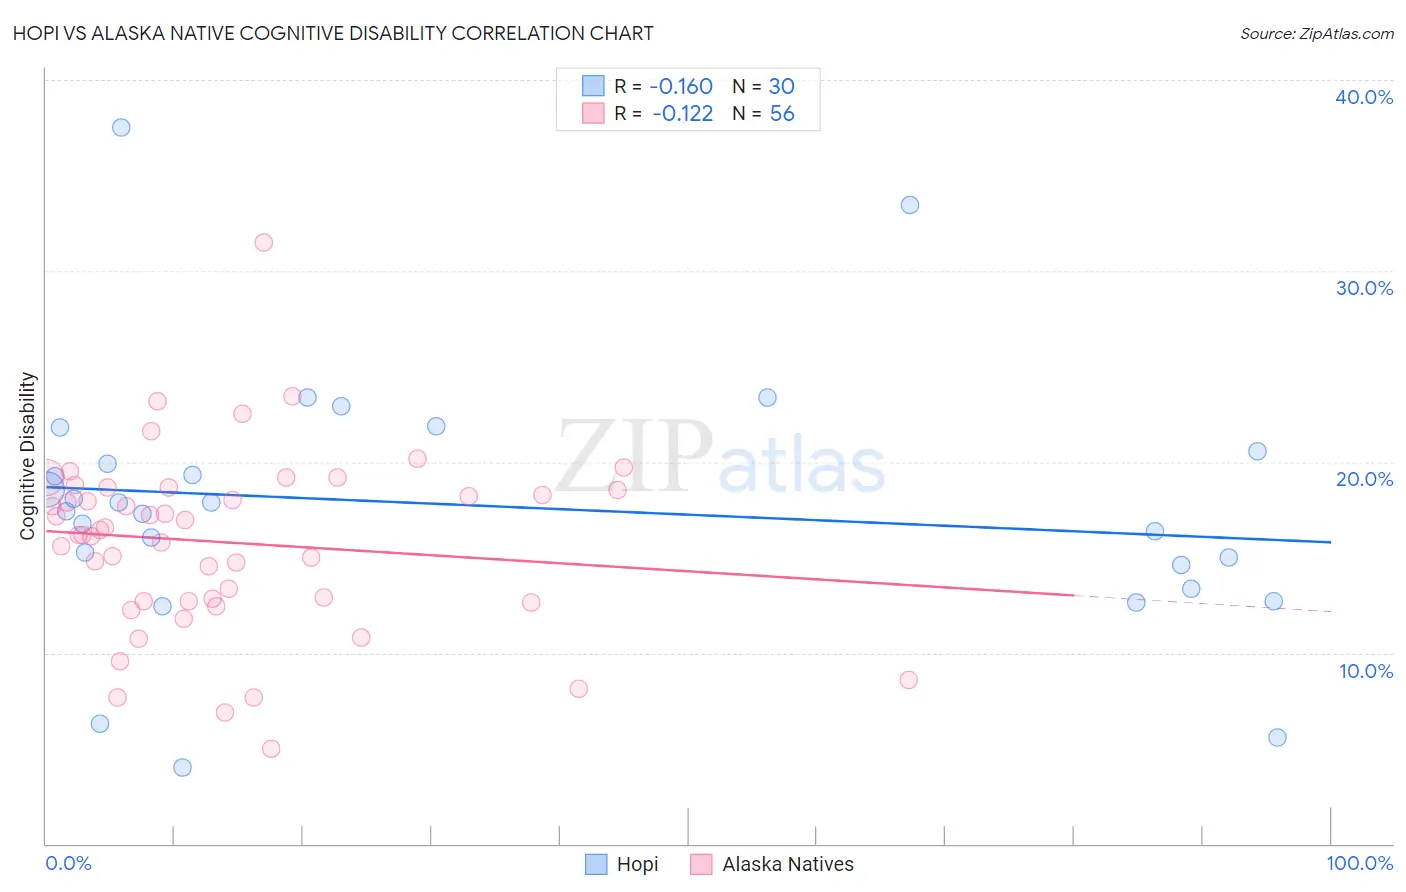
Hopi vs Alaska Native Cognitive Disability Correlation Chart
The statistical analysis conducted on geographies consisting of 74,733,532 people shows a poor negative correlation between the proportion of Hopi and percentage of population with cognitive disability in the United States with a correlation coefficient (R) of -0.160 and weighted average of 17.9%. Similarly, the statistical analysis conducted on geographies consisting of 76,778,470 people shows a poor negative correlation between the proportion of Alaska Natives and percentage of population with cognitive disability in the United States with a correlation coefficient (R) of -0.122 and weighted average of 17.5%, a difference of 2.1%.
Cognitive Disability Correlation Summary
| Measurement | Hopi | Alaska Native |
| Minimum | 4.0% | 5.0% |
| Maximum | 37.5% | 31.5% |
| Range | 33.5% | 26.5% |
| Mean | 17.7% | 15.8% |
| Median | 17.6% | 16.3% |
| Interquartile 25% (IQ1) | 14.6% | 12.7% |
| Interquartile 75% (IQ3) | 20.5% | 18.6% |
| Interquartile Range (IQR) | 6.0% | 5.9% |
| Standard Deviation (Sample) | 6.9% | 4.7% |
| Standard Deviation (Population) | 6.8% | 4.7% |
Similar Demographics by Cognitive Disability
Demographics Similar to Hopi by Cognitive Disability
In terms of cognitive disability, the demographic groups most similar to Hopi are Hispanic or Latino (17.9%, a difference of 0.0%), Immigrants from Grenada (17.9%, a difference of 0.010%), Immigrants from the Azores (17.9%, a difference of 0.010%), Bahamian (17.9%, a difference of 0.010%), and Cree (17.9%, a difference of 0.030%).
| Demographics | Rating | Rank | Cognitive Disability |
| Immigrants | Thailand | 0.8 /100 | #246 | Tragic 17.9% |
| Samoans | 0.7 /100 | #247 | Tragic 17.9% |
| French American Indians | 0.7 /100 | #248 | Tragic 17.9% |
| Cree | 0.7 /100 | #249 | Tragic 17.9% |
| Immigrants | Ethiopia | 0.7 /100 | #250 | Tragic 17.9% |
| Malaysians | 0.6 /100 | #251 | Tragic 17.9% |
| Immigrants | Grenada | 0.6 /100 | #252 | Tragic 17.9% |
| Hopi | 0.6 /100 | #253 | Tragic 17.9% |
| Hispanics or Latinos | 0.6 /100 | #254 | Tragic 17.9% |
| Immigrants | Azores | 0.6 /100 | #255 | Tragic 17.9% |
| Bahamians | 0.6 /100 | #256 | Tragic 17.9% |
| Mexican American Indians | 0.6 /100 | #257 | Tragic 17.9% |
| Immigrants | Armenia | 0.6 /100 | #258 | Tragic 17.9% |
| Ethiopians | 0.5 /100 | #259 | Tragic 17.9% |
| Immigrants | Belize | 0.5 /100 | #260 | Tragic 17.9% |
Demographics Similar to Alaska Natives by Cognitive Disability
In terms of cognitive disability, the demographic groups most similar to Alaska Natives are Immigrants from Zimbabwe (17.5%, a difference of 0.040%), Puget Sound Salish (17.5%, a difference of 0.040%), Immigrants from Caribbean (17.5%, a difference of 0.050%), Immigrants from Latin America (17.6%, a difference of 0.050%), and Immigrants from Cameroon (17.6%, a difference of 0.090%).
| Demographics | Rating | Rank | Cognitive Disability |
| Immigrants | Singapore | 14.3 /100 | #199 | Poor 17.5% |
| Haitians | 14.1 /100 | #200 | Poor 17.5% |
| South American Indians | 13.0 /100 | #201 | Poor 17.5% |
| Immigrants | Morocco | 12.0 /100 | #202 | Poor 17.5% |
| Immigrants | Caribbean | 11.0 /100 | #203 | Poor 17.5% |
| Immigrants | Zimbabwe | 11.0 /100 | #204 | Poor 17.5% |
| Puget Sound Salish | 10.9 /100 | #205 | Poor 17.5% |
| Alaska Natives | 10.4 /100 | #206 | Poor 17.5% |
| Immigrants | Latin America | 9.7 /100 | #207 | Tragic 17.6% |
| Immigrants | Cameroon | 9.3 /100 | #208 | Tragic 17.6% |
| Immigrants | Trinidad and Tobago | 8.7 /100 | #209 | Tragic 17.6% |
| Immigrants | Jamaica | 8.5 /100 | #210 | Tragic 17.6% |
| Taiwanese | 7.7 /100 | #211 | Tragic 17.6% |
| Immigrants | Oceania | 7.3 /100 | #212 | Tragic 17.6% |
| Hawaiians | 7.2 /100 | #213 | Tragic 17.6% |