Hopi vs Immigrants from Caribbean Hearing Disability
COMPARE
Hopi
Immigrants from Caribbean
Hearing Disability
Hearing Disability Comparison
Hopi
Immigrants from Caribbean
3.9%
HEARING DISABILITY
0.0/ 100
METRIC RATING
313th/ 347
METRIC RANK
2.6%
HEARING DISABILITY
99.7/ 100
METRIC RATING
30th/ 347
METRIC RANK
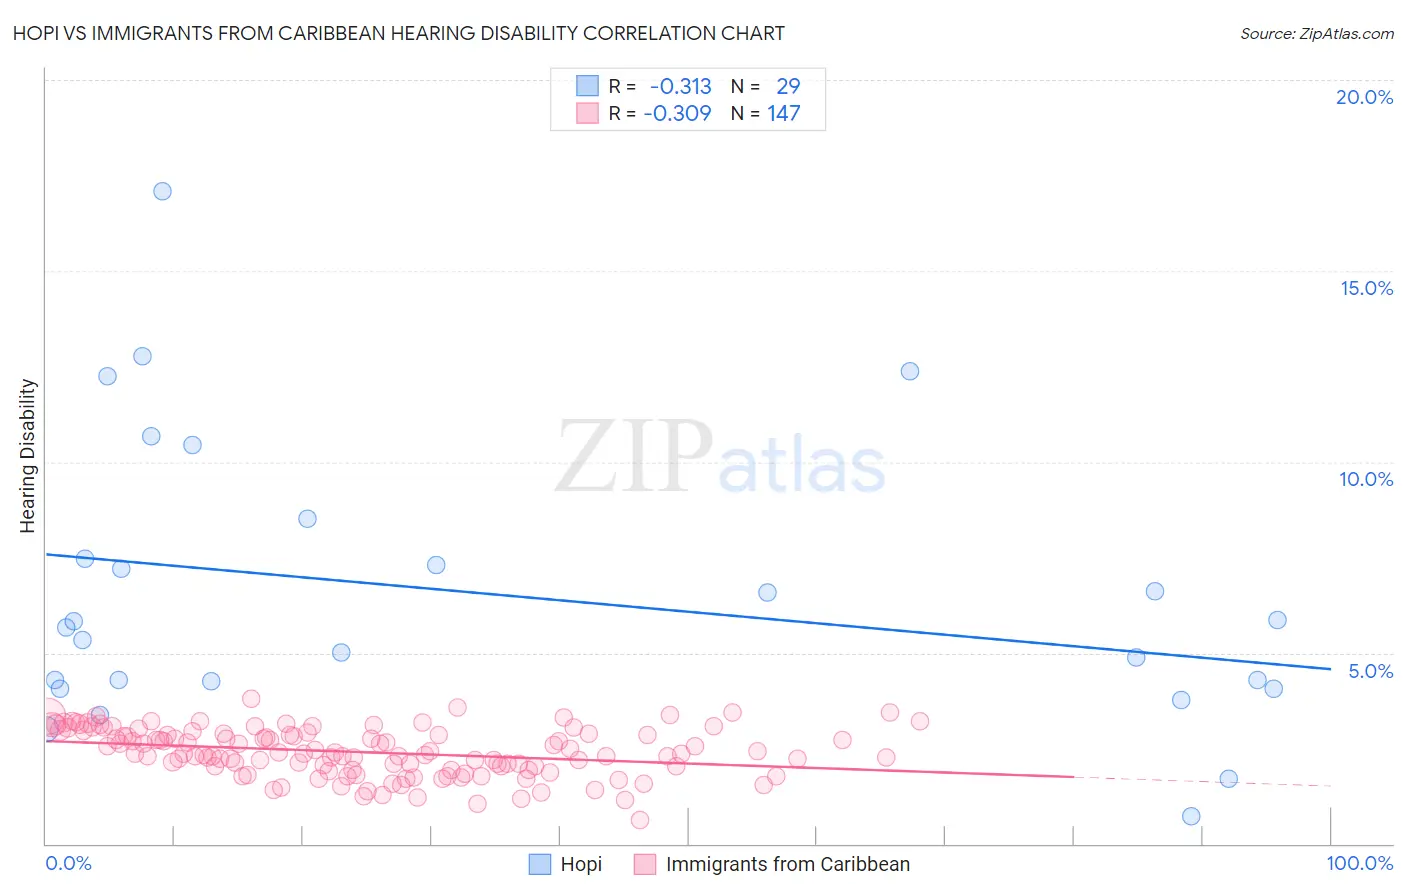
Hopi vs Immigrants from Caribbean Hearing Disability Correlation Chart
The statistical analysis conducted on geographies consisting of 74,726,897 people shows a mild negative correlation between the proportion of Hopi and percentage of population with hearing disability in the United States with a correlation coefficient (R) of -0.313 and weighted average of 3.9%. Similarly, the statistical analysis conducted on geographies consisting of 449,729,133 people shows a mild negative correlation between the proportion of Immigrants from Caribbean and percentage of population with hearing disability in the United States with a correlation coefficient (R) of -0.309 and weighted average of 2.6%, a difference of 51.9%.
Hearing Disability Correlation Summary
| Measurement | Hopi | Immigrants from Caribbean |
| Minimum | 0.73% | 0.62% |
| Maximum | 17.1% | 3.8% |
| Range | 16.3% | 3.2% |
| Mean | 6.5% | 2.4% |
| Median | 5.7% | 2.4% |
| Interquartile 25% (IQ1) | 4.2% | 1.9% |
| Interquartile 75% (IQ3) | 8.0% | 2.9% |
| Interquartile Range (IQR) | 3.8% | 0.93% |
| Standard Deviation (Sample) | 3.7% | 0.62% |
| Standard Deviation (Population) | 3.6% | 0.62% |
Similar Demographics by Hearing Disability
Demographics Similar to Hopi by Hearing Disability
In terms of hearing disability, the demographic groups most similar to Hopi are Cajun (3.9%, a difference of 0.11%), Yakama (3.9%, a difference of 0.17%), Puget Sound Salish (3.9%, a difference of 0.18%), Spanish American (4.0%, a difference of 0.38%), and Comanche (4.0%, a difference of 0.51%).
| Demographics | Rating | Rank | Hearing Disability |
| Marshallese | 0.0 /100 | #306 | Tragic 3.8% |
| French Canadians | 0.0 /100 | #307 | Tragic 3.8% |
| Ottawa | 0.0 /100 | #308 | Tragic 3.8% |
| Scotch-Irish | 0.0 /100 | #309 | Tragic 3.8% |
| Cree | 0.0 /100 | #310 | Tragic 3.8% |
| Americans | 0.0 /100 | #311 | Tragic 3.9% |
| Cajuns | 0.0 /100 | #312 | Tragic 3.9% |
| Hopi | 0.0 /100 | #313 | Tragic 3.9% |
| Yakama | 0.0 /100 | #314 | Tragic 3.9% |
| Puget Sound Salish | 0.0 /100 | #315 | Tragic 3.9% |
| Spanish Americans | 0.0 /100 | #316 | Tragic 4.0% |
| Comanche | 0.0 /100 | #317 | Tragic 4.0% |
| Cheyenne | 0.0 /100 | #318 | Tragic 4.0% |
| Chippewa | 0.0 /100 | #319 | Tragic 4.0% |
| Shoshone | 0.0 /100 | #320 | Tragic 4.0% |
Demographics Similar to Immigrants from Caribbean by Hearing Disability
In terms of hearing disability, the demographic groups most similar to Immigrants from Caribbean are Immigrants from Cameroon (2.6%, a difference of 0.010%), Bolivian (2.6%, a difference of 0.080%), Immigrants from Haiti (2.6%, a difference of 0.10%), Immigrants from Venezuela (2.6%, a difference of 0.16%), and Filipino (2.6%, a difference of 0.42%).
| Demographics | Rating | Rank | Hearing Disability |
| Immigrants | Nigeria | 99.8 /100 | #23 | Exceptional 2.6% |
| Immigrants | Ghana | 99.8 /100 | #24 | Exceptional 2.6% |
| Immigrants | El Salvador | 99.7 /100 | #25 | Exceptional 2.6% |
| Immigrants | Senegal | 99.7 /100 | #26 | Exceptional 2.6% |
| Immigrants | South Central Asia | 99.7 /100 | #27 | Exceptional 2.6% |
| Immigrants | Haiti | 99.7 /100 | #28 | Exceptional 2.6% |
| Bolivians | 99.7 /100 | #29 | Exceptional 2.6% |
| Immigrants | Caribbean | 99.7 /100 | #30 | Exceptional 2.6% |
| Immigrants | Cameroon | 99.7 /100 | #31 | Exceptional 2.6% |
| Immigrants | Venezuela | 99.7 /100 | #32 | Exceptional 2.6% |
| Filipinos | 99.6 /100 | #33 | Exceptional 2.6% |
| Immigrants | Pakistan | 99.6 /100 | #34 | Exceptional 2.6% |
| Salvadorans | 99.6 /100 | #35 | Exceptional 2.6% |
| Okinawans | 99.6 /100 | #36 | Exceptional 2.6% |
| Immigrants | Western Africa | 99.6 /100 | #37 | Exceptional 2.6% |