Immigrants from England vs Bahamian Disability Age Under 5
COMPARE
Immigrants from England
Bahamian
Disability Age Under 5
Disability Age Under 5 Comparison
Immigrants from England
Bahamians
1.4%
DISABILITY AGE UNDER 5
1.0/ 100
METRIC RATING
247th/ 347
METRIC RANK
1.3%
DISABILITY AGE UNDER 5
7.1/ 100
METRIC RATING
226th/ 347
METRIC RANK
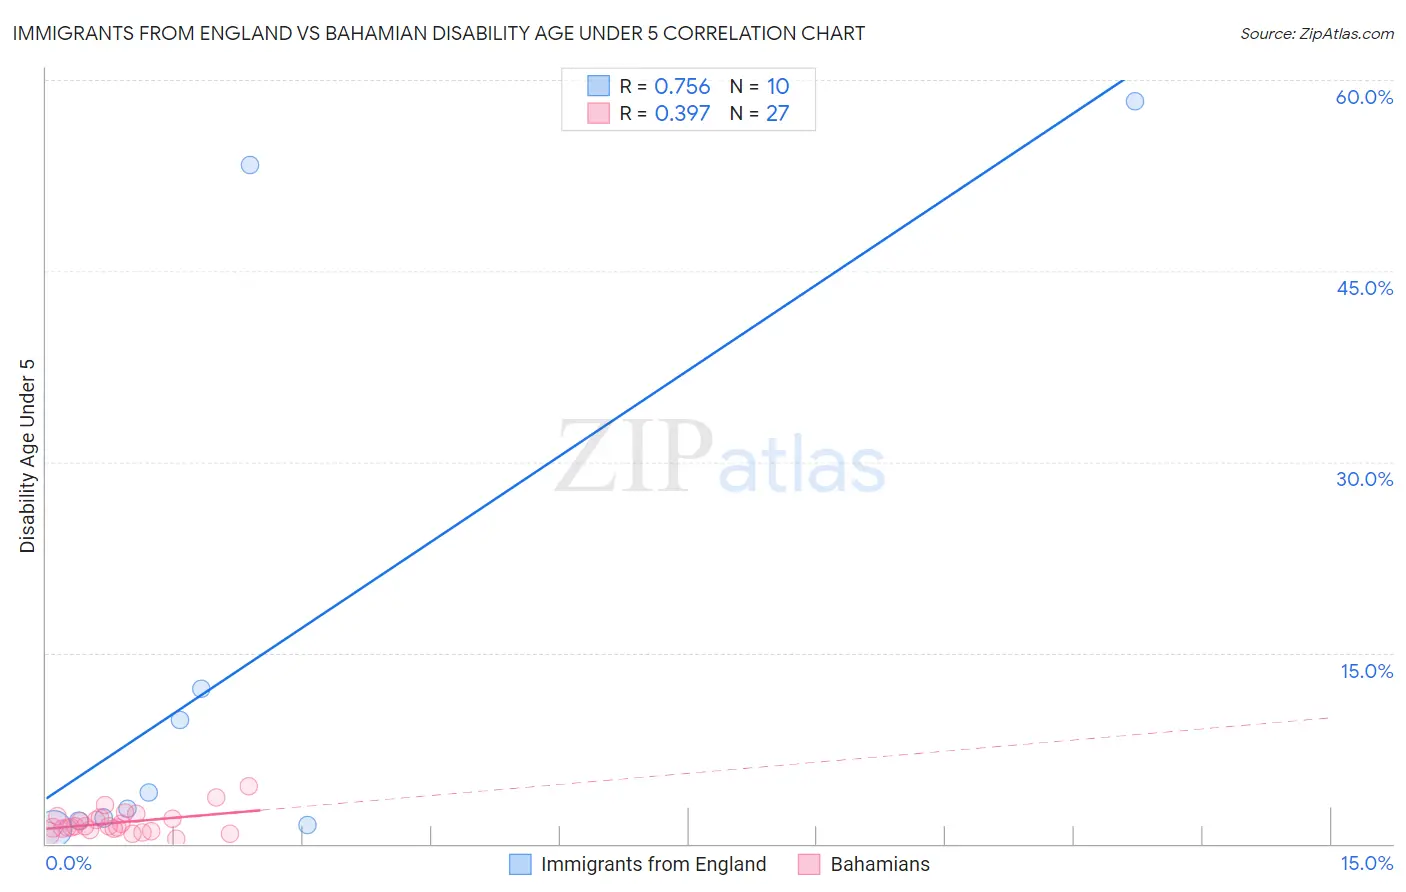
Immigrants from England vs Bahamian Disability Age Under 5 Correlation Chart
The statistical analysis conducted on geographies consisting of 209,371,779 people shows a strong positive correlation between the proportion of Immigrants from England and percentage of population with a disability under the age of 5 in the United States with a correlation coefficient (R) of 0.756 and weighted average of 1.4%. Similarly, the statistical analysis conducted on geographies consisting of 81,811,004 people shows a mild positive correlation between the proportion of Bahamians and percentage of population with a disability under the age of 5 in the United States with a correlation coefficient (R) of 0.397 and weighted average of 1.3%, a difference of 4.3%.
Disability Age Under 5 Correlation Summary
| Measurement | Immigrants from England | Bahamian |
| Minimum | 1.2% | 0.43% |
| Maximum | 58.3% | 4.6% |
| Range | 57.2% | 4.1% |
| Mean | 14.7% | 1.7% |
| Median | 3.4% | 1.3% |
| Interquartile 25% (IQ1) | 1.8% | 1.1% |
| Interquartile 75% (IQ3) | 12.1% | 2.0% |
| Interquartile Range (IQR) | 10.3% | 0.92% |
| Standard Deviation (Sample) | 22.0% | 0.92% |
| Standard Deviation (Population) | 20.9% | 0.90% |
Similar Demographics by Disability Age Under 5
Demographics Similar to Immigrants from England by Disability Age Under 5
In terms of disability age under 5, the demographic groups most similar to Immigrants from England are Russian (1.4%, a difference of 0.010%), Eastern European (1.4%, a difference of 0.030%), Bermudan (1.4%, a difference of 0.11%), African (1.4%, a difference of 0.12%), and Potawatomi (1.4%, a difference of 0.14%).
| Demographics | Rating | Rank | Disability Age Under 5 |
| Native Hawaiians | 2.2 /100 | #240 | Tragic 1.3% |
| Maltese | 2.2 /100 | #241 | Tragic 1.3% |
| Lumbee | 2.1 /100 | #242 | Tragic 1.3% |
| Immigrants | Cameroon | 1.7 /100 | #243 | Tragic 1.4% |
| Spaniards | 1.4 /100 | #244 | Tragic 1.4% |
| Potawatomi | 1.1 /100 | #245 | Tragic 1.4% |
| Russians | 1.0 /100 | #246 | Tragic 1.4% |
| Immigrants | England | 1.0 /100 | #247 | Tragic 1.4% |
| Eastern Europeans | 1.0 /100 | #248 | Tragic 1.4% |
| Bermudans | 1.0 /100 | #249 | Tragic 1.4% |
| Africans | 1.0 /100 | #250 | Tragic 1.4% |
| Immigrants | Hungary | 1.0 /100 | #251 | Tragic 1.4% |
| Immigrants | Scotland | 0.9 /100 | #252 | Tragic 1.4% |
| Australians | 0.7 /100 | #253 | Tragic 1.4% |
| Immigrants | Brazil | 0.7 /100 | #254 | Tragic 1.4% |
Demographics Similar to Bahamians by Disability Age Under 5
In terms of disability age under 5, the demographic groups most similar to Bahamians are Panamanian (1.3%, a difference of 0.0%), Latvian (1.3%, a difference of 0.030%), Hispanic or Latino (1.3%, a difference of 0.19%), Taiwanese (1.3%, a difference of 0.34%), and Luxembourger (1.3%, a difference of 0.35%).
| Demographics | Rating | Rank | Disability Age Under 5 |
| Immigrants | Croatia | 11.2 /100 | #219 | Poor 1.3% |
| Serbians | 9.6 /100 | #220 | Tragic 1.3% |
| Sub-Saharan Africans | 8.3 /100 | #221 | Tragic 1.3% |
| Ukrainians | 8.3 /100 | #222 | Tragic 1.3% |
| Hispanics or Latinos | 7.7 /100 | #223 | Tragic 1.3% |
| Latvians | 7.1 /100 | #224 | Tragic 1.3% |
| Panamanians | 7.1 /100 | #225 | Tragic 1.3% |
| Bahamians | 7.1 /100 | #226 | Tragic 1.3% |
| Taiwanese | 6.1 /100 | #227 | Tragic 1.3% |
| Luxembourgers | 6.1 /100 | #228 | Tragic 1.3% |
| Immigrants | Costa Rica | 5.5 /100 | #229 | Tragic 1.3% |
| Lebanese | 5.3 /100 | #230 | Tragic 1.3% |
| Immigrants | Northern Europe | 4.7 /100 | #231 | Tragic 1.3% |
| French American Indians | 4.5 /100 | #232 | Tragic 1.3% |
| Tongans | 4.2 /100 | #233 | Tragic 1.3% |