Indonesian vs Bahamian Disability Age Under 5
COMPARE
Indonesian
Bahamian
Disability Age Under 5
Disability Age Under 5 Comparison
Indonesians
Bahamians
1.2%
DISABILITY AGE UNDER 5
95.9/ 100
METRIC RATING
104th/ 347
METRIC RANK
1.3%
DISABILITY AGE UNDER 5
7.1/ 100
METRIC RATING
226th/ 347
METRIC RANK
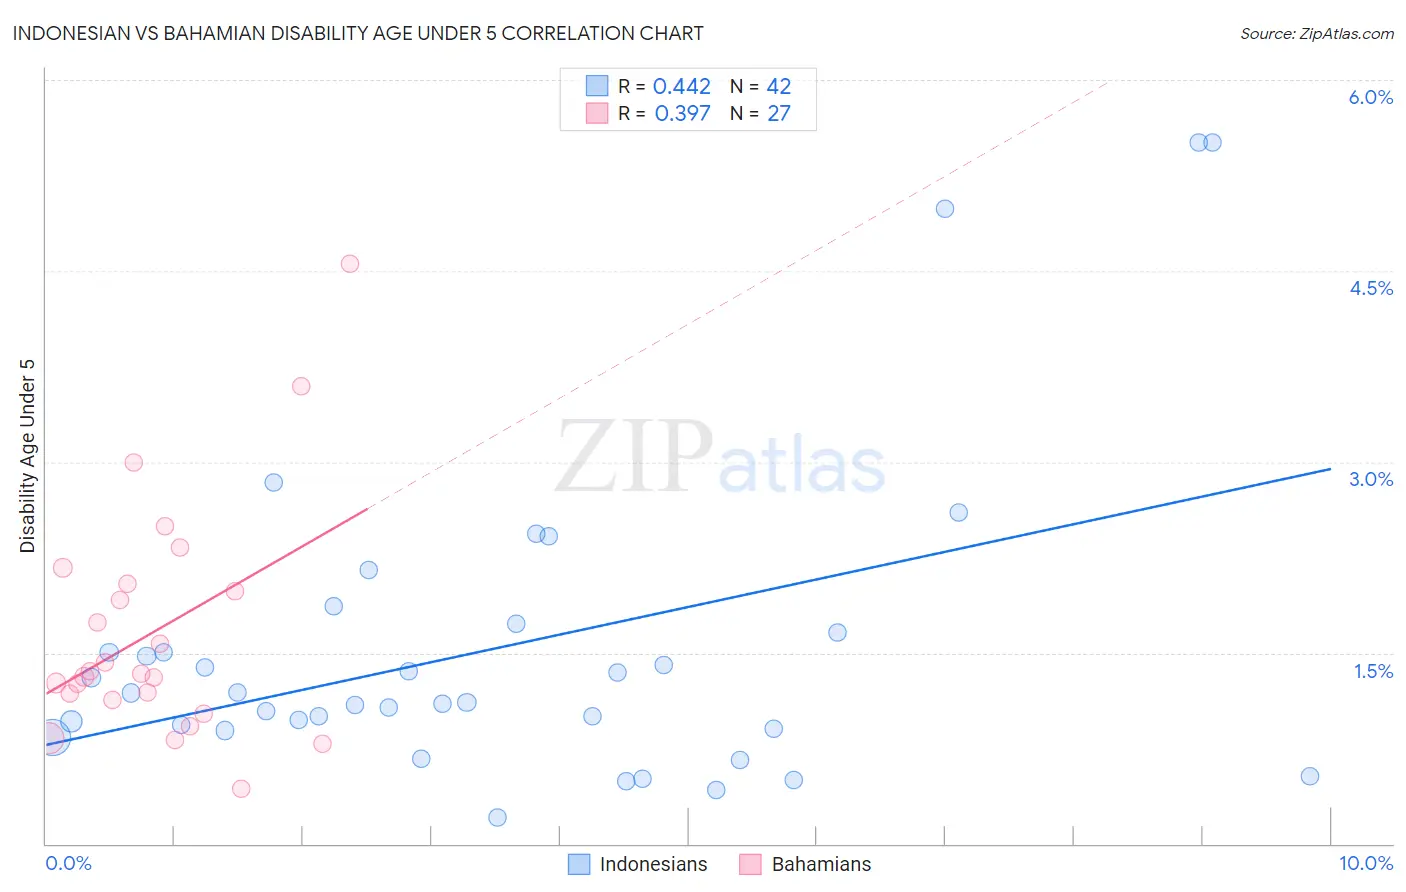
Indonesian vs Bahamian Disability Age Under 5 Correlation Chart
The statistical analysis conducted on geographies consisting of 116,670,957 people shows a moderate positive correlation between the proportion of Indonesians and percentage of population with a disability under the age of 5 in the United States with a correlation coefficient (R) of 0.442 and weighted average of 1.2%. Similarly, the statistical analysis conducted on geographies consisting of 81,811,004 people shows a mild positive correlation between the proportion of Bahamians and percentage of population with a disability under the age of 5 in the United States with a correlation coefficient (R) of 0.397 and weighted average of 1.3%, a difference of 14.0%.
Disability Age Under 5 Correlation Summary
| Measurement | Indonesian | Bahamian |
| Minimum | 0.21% | 0.43% |
| Maximum | 5.5% | 4.6% |
| Range | 5.3% | 4.1% |
| Mean | 1.5% | 1.7% |
| Median | 1.1% | 1.3% |
| Interquartile 25% (IQ1) | 0.90% | 1.1% |
| Interquartile 75% (IQ3) | 1.7% | 2.0% |
| Interquartile Range (IQR) | 0.76% | 0.92% |
| Standard Deviation (Sample) | 1.2% | 0.92% |
| Standard Deviation (Population) | 1.2% | 0.90% |
Similar Demographics by Disability Age Under 5
Demographics Similar to Indonesians by Disability Age Under 5
In terms of disability age under 5, the demographic groups most similar to Indonesians are Immigrants from Morocco (1.2%, a difference of 0.070%), Immigrants from Nicaragua (1.2%, a difference of 0.070%), Immigrants from Uganda (1.1%, a difference of 0.12%), Immigrants from South Africa (1.2%, a difference of 0.19%), and Nicaraguan (1.1%, a difference of 0.24%).
| Demographics | Rating | Rank | Disability Age Under 5 |
| Immigrants | Iraq | 96.5 /100 | #97 | Exceptional 1.1% |
| Immigrants | South Eastern Asia | 96.5 /100 | #98 | Exceptional 1.1% |
| Dominicans | 96.3 /100 | #99 | Exceptional 1.1% |
| Nicaraguans | 96.3 /100 | #100 | Exceptional 1.1% |
| Immigrants | Uganda | 96.1 /100 | #101 | Exceptional 1.1% |
| Immigrants | Morocco | 96.0 /100 | #102 | Exceptional 1.2% |
| Immigrants | Nicaragua | 96.0 /100 | #103 | Exceptional 1.2% |
| Indonesians | 95.9 /100 | #104 | Exceptional 1.2% |
| Immigrants | South Africa | 95.6 /100 | #105 | Exceptional 1.2% |
| Cambodians | 95.4 /100 | #106 | Exceptional 1.2% |
| Immigrants | West Indies | 95.3 /100 | #107 | Exceptional 1.2% |
| Iraqis | 95.1 /100 | #108 | Exceptional 1.2% |
| Immigrants | Panama | 95.0 /100 | #109 | Exceptional 1.2% |
| Immigrants | Lebanon | 95.0 /100 | #110 | Exceptional 1.2% |
| Senegalese | 94.6 /100 | #111 | Exceptional 1.2% |
Demographics Similar to Bahamians by Disability Age Under 5
In terms of disability age under 5, the demographic groups most similar to Bahamians are Panamanian (1.3%, a difference of 0.0%), Latvian (1.3%, a difference of 0.030%), Hispanic or Latino (1.3%, a difference of 0.19%), Taiwanese (1.3%, a difference of 0.34%), and Luxembourger (1.3%, a difference of 0.35%).
| Demographics | Rating | Rank | Disability Age Under 5 |
| Immigrants | Croatia | 11.2 /100 | #219 | Poor 1.3% |
| Serbians | 9.6 /100 | #220 | Tragic 1.3% |
| Sub-Saharan Africans | 8.3 /100 | #221 | Tragic 1.3% |
| Ukrainians | 8.3 /100 | #222 | Tragic 1.3% |
| Hispanics or Latinos | 7.7 /100 | #223 | Tragic 1.3% |
| Latvians | 7.1 /100 | #224 | Tragic 1.3% |
| Panamanians | 7.1 /100 | #225 | Tragic 1.3% |
| Bahamians | 7.1 /100 | #226 | Tragic 1.3% |
| Taiwanese | 6.1 /100 | #227 | Tragic 1.3% |
| Luxembourgers | 6.1 /100 | #228 | Tragic 1.3% |
| Immigrants | Costa Rica | 5.5 /100 | #229 | Tragic 1.3% |
| Lebanese | 5.3 /100 | #230 | Tragic 1.3% |
| Immigrants | Northern Europe | 4.7 /100 | #231 | Tragic 1.3% |
| French American Indians | 4.5 /100 | #232 | Tragic 1.3% |
| Tongans | 4.2 /100 | #233 | Tragic 1.3% |