Immigrants from Dominican Republic vs Bahamian Disability Age Under 5
COMPARE
Immigrants from Dominican Republic
Bahamian
Disability Age Under 5
Disability Age Under 5 Comparison
Immigrants from Dominican Republic
Bahamians
1.1%
DISABILITY AGE UNDER 5
97.5/ 100
METRIC RATING
88th/ 347
METRIC RANK
1.3%
DISABILITY AGE UNDER 5
7.1/ 100
METRIC RATING
226th/ 347
METRIC RANK
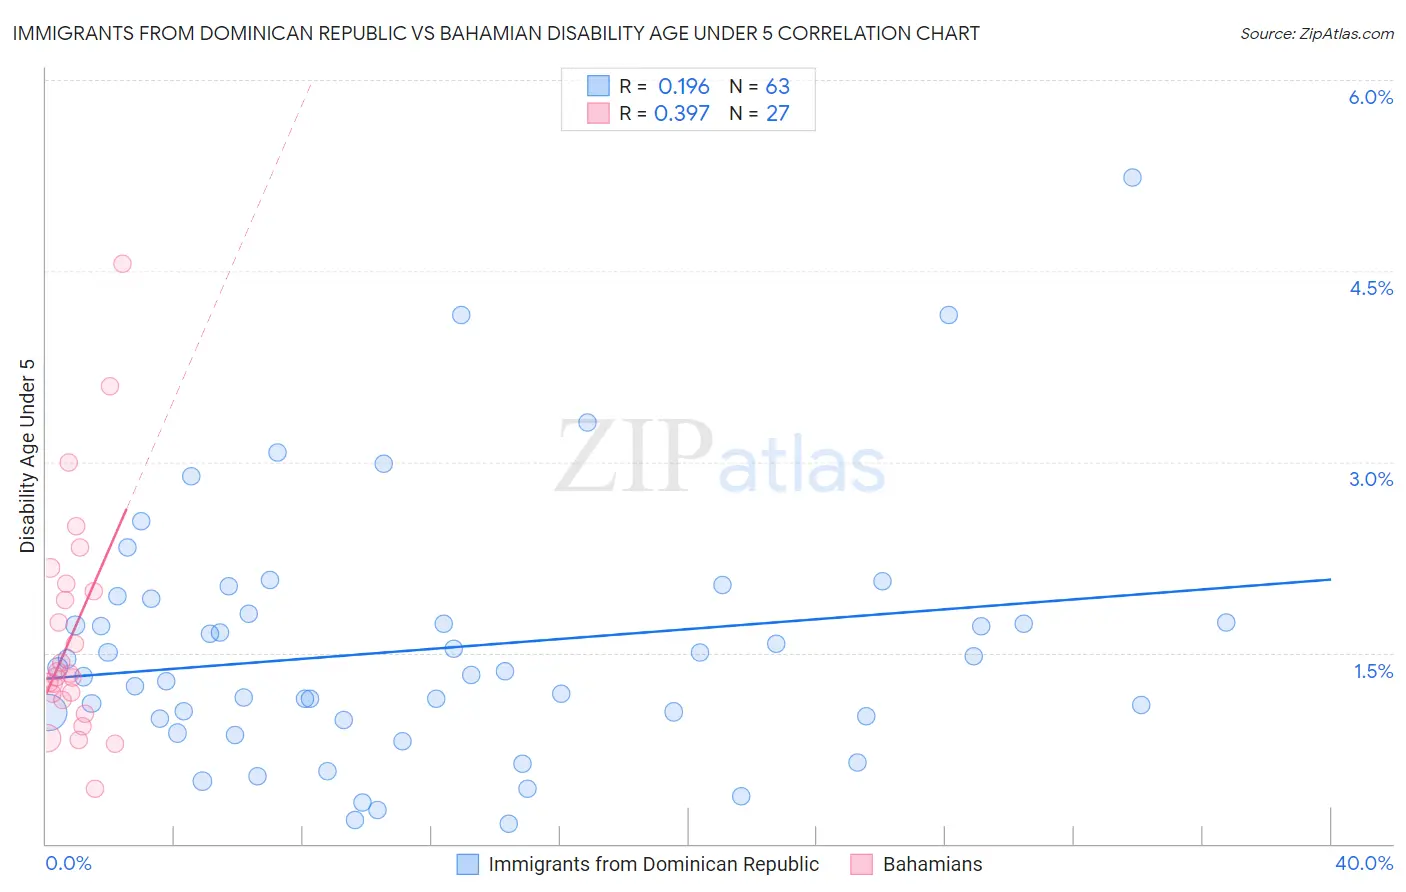
Immigrants from Dominican Republic vs Bahamian Disability Age Under 5 Correlation Chart
The statistical analysis conducted on geographies consisting of 160,628,361 people shows a poor positive correlation between the proportion of Immigrants from Dominican Republic and percentage of population with a disability under the age of 5 in the United States with a correlation coefficient (R) of 0.196 and weighted average of 1.1%. Similarly, the statistical analysis conducted on geographies consisting of 81,811,004 people shows a mild positive correlation between the proportion of Bahamians and percentage of population with a disability under the age of 5 in the United States with a correlation coefficient (R) of 0.397 and weighted average of 1.3%, a difference of 15.4%.
Disability Age Under 5 Correlation Summary
| Measurement | Immigrants from Dominican Republic | Bahamian |
| Minimum | 0.15% | 0.43% |
| Maximum | 5.2% | 4.6% |
| Range | 5.1% | 4.1% |
| Mean | 1.5% | 1.7% |
| Median | 1.4% | 1.3% |
| Interquartile 25% (IQ1) | 0.99% | 1.1% |
| Interquartile 75% (IQ3) | 1.8% | 2.0% |
| Interquartile Range (IQR) | 0.82% | 0.92% |
| Standard Deviation (Sample) | 0.97% | 0.92% |
| Standard Deviation (Population) | 0.97% | 0.90% |
Similar Demographics by Disability Age Under 5
Demographics Similar to Immigrants from Dominican Republic by Disability Age Under 5
In terms of disability age under 5, the demographic groups most similar to Immigrants from Dominican Republic are Ugandan (1.1%, a difference of 0.020%), Okinawan (1.1%, a difference of 0.040%), Sudanese (1.1%, a difference of 0.17%), Immigrants from Zaire (1.1%, a difference of 0.25%), and Ethiopian (1.1%, a difference of 0.28%).
| Demographics | Rating | Rank | Disability Age Under 5 |
| Turks | 98.0 /100 | #81 | Exceptional 1.1% |
| Immigrants | Jordan | 97.9 /100 | #82 | Exceptional 1.1% |
| Immigrants | Syria | 97.9 /100 | #83 | Exceptional 1.1% |
| Immigrants | Zaire | 97.8 /100 | #84 | Exceptional 1.1% |
| Sudanese | 97.7 /100 | #85 | Exceptional 1.1% |
| Okinawans | 97.6 /100 | #86 | Exceptional 1.1% |
| Ugandans | 97.5 /100 | #87 | Exceptional 1.1% |
| Immigrants | Dominican Republic | 97.5 /100 | #88 | Exceptional 1.1% |
| Ethiopians | 97.2 /100 | #89 | Exceptional 1.1% |
| Chinese | 97.2 /100 | #90 | Exceptional 1.1% |
| Albanians | 97.2 /100 | #91 | Exceptional 1.1% |
| Immigrants | Cuba | 97.0 /100 | #92 | Exceptional 1.1% |
| Spanish Americans | 96.9 /100 | #93 | Exceptional 1.1% |
| Sri Lankans | 96.8 /100 | #94 | Exceptional 1.1% |
| Immigrants | Moldova | 96.8 /100 | #95 | Exceptional 1.1% |
Demographics Similar to Bahamians by Disability Age Under 5
In terms of disability age under 5, the demographic groups most similar to Bahamians are Panamanian (1.3%, a difference of 0.0%), Latvian (1.3%, a difference of 0.030%), Hispanic or Latino (1.3%, a difference of 0.19%), Taiwanese (1.3%, a difference of 0.34%), and Luxembourger (1.3%, a difference of 0.35%).
| Demographics | Rating | Rank | Disability Age Under 5 |
| Immigrants | Croatia | 11.2 /100 | #219 | Poor 1.3% |
| Serbians | 9.6 /100 | #220 | Tragic 1.3% |
| Sub-Saharan Africans | 8.3 /100 | #221 | Tragic 1.3% |
| Ukrainians | 8.3 /100 | #222 | Tragic 1.3% |
| Hispanics or Latinos | 7.7 /100 | #223 | Tragic 1.3% |
| Latvians | 7.1 /100 | #224 | Tragic 1.3% |
| Panamanians | 7.1 /100 | #225 | Tragic 1.3% |
| Bahamians | 7.1 /100 | #226 | Tragic 1.3% |
| Taiwanese | 6.1 /100 | #227 | Tragic 1.3% |
| Luxembourgers | 6.1 /100 | #228 | Tragic 1.3% |
| Immigrants | Costa Rica | 5.5 /100 | #229 | Tragic 1.3% |
| Lebanese | 5.3 /100 | #230 | Tragic 1.3% |
| Immigrants | Northern Europe | 4.7 /100 | #231 | Tragic 1.3% |
| French American Indians | 4.5 /100 | #232 | Tragic 1.3% |
| Tongans | 4.2 /100 | #233 | Tragic 1.3% |