Immigrants from Africa vs Asian Disability Age Under 5
COMPARE
Immigrants from Africa
Asian
Disability Age Under 5
Disability Age Under 5 Comparison
Immigrants from Africa
Asians
1.2%
DISABILITY AGE UNDER 5
65.1/ 100
METRIC RATING
161st/ 347
METRIC RANK
1.1%
DISABILITY AGE UNDER 5
99.6/ 100
METRIC RATING
53rd/ 347
METRIC RANK
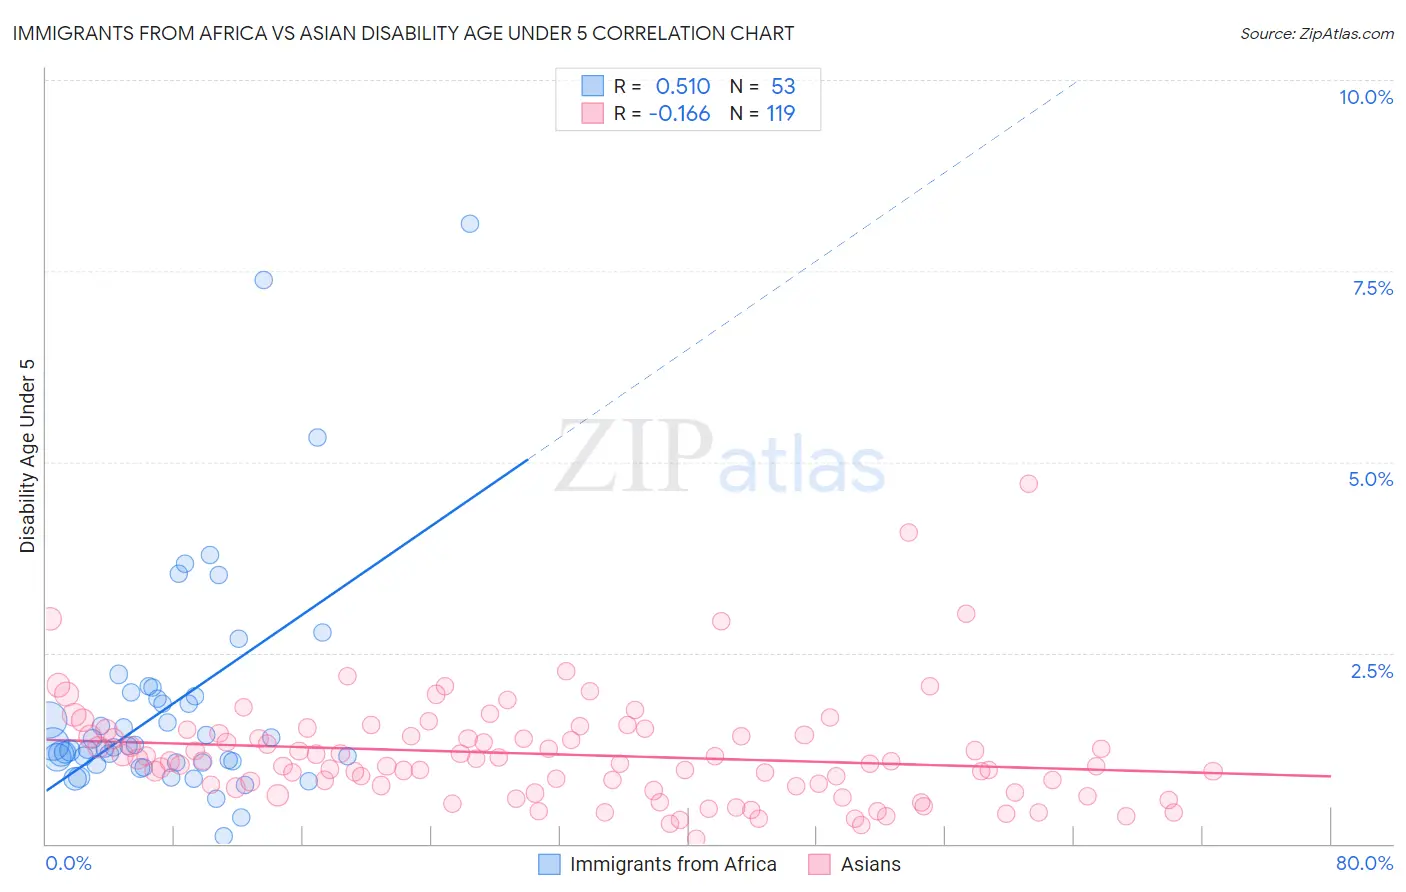
Immigrants from Africa vs Asian Disability Age Under 5 Correlation Chart
The statistical analysis conducted on geographies consisting of 240,976,621 people shows a substantial positive correlation between the proportion of Immigrants from Africa and percentage of population with a disability under the age of 5 in the United States with a correlation coefficient (R) of 0.510 and weighted average of 1.2%. Similarly, the statistical analysis conducted on geographies consisting of 258,933,212 people shows a poor negative correlation between the proportion of Asians and percentage of population with a disability under the age of 5 in the United States with a correlation coefficient (R) of -0.166 and weighted average of 1.1%, a difference of 12.7%.
Disability Age Under 5 Correlation Summary
| Measurement | Immigrants from Africa | Asian |
| Minimum | 0.10% | 0.058% |
| Maximum | 8.1% | 4.7% |
| Range | 8.0% | 4.7% |
| Mean | 1.8% | 1.2% |
| Median | 1.3% | 1.1% |
| Interquartile 25% (IQ1) | 1.1% | 0.73% |
| Interquartile 75% (IQ3) | 2.0% | 1.4% |
| Interquartile Range (IQR) | 0.89% | 0.69% |
| Standard Deviation (Sample) | 1.5% | 0.71% |
| Standard Deviation (Population) | 1.5% | 0.70% |
Similar Demographics by Disability Age Under 5
Demographics Similar to Immigrants from Africa by Disability Age Under 5
In terms of disability age under 5, the demographic groups most similar to Immigrants from Africa are Colombian (1.2%, a difference of 0.070%), Immigrants from Latin America (1.2%, a difference of 0.070%), Arab (1.2%, a difference of 0.13%), Guatemalan (1.2%, a difference of 0.15%), and Immigrants from South America (1.2%, a difference of 0.19%).
| Demographics | Rating | Rank | Disability Age Under 5 |
| Uruguayans | 68.8 /100 | #154 | Good 1.2% |
| Immigrants | Ghana | 68.7 /100 | #155 | Good 1.2% |
| Hawaiians | 68.5 /100 | #156 | Good 1.2% |
| Immigrants | South America | 67.0 /100 | #157 | Good 1.2% |
| Arabs | 66.4 /100 | #158 | Good 1.2% |
| Colombians | 65.8 /100 | #159 | Good 1.2% |
| Immigrants | Latin America | 65.8 /100 | #160 | Good 1.2% |
| Immigrants | Africa | 65.1 /100 | #161 | Good 1.2% |
| Guatemalans | 63.6 /100 | #162 | Good 1.2% |
| Immigrants | Guatemala | 63.2 /100 | #163 | Good 1.2% |
| Laotians | 62.8 /100 | #164 | Good 1.2% |
| Immigrants | Kuwait | 62.6 /100 | #165 | Good 1.2% |
| Immigrants | Central America | 61.4 /100 | #166 | Good 1.2% |
| Immigrants | Argentina | 60.2 /100 | #167 | Good 1.2% |
| Sierra Leoneans | 59.1 /100 | #168 | Average 1.2% |
Demographics Similar to Asians by Disability Age Under 5
In terms of disability age under 5, the demographic groups most similar to Asians are Immigrants from El Salvador (1.1%, a difference of 0.29%), Immigrants from Bolivia (1.1%, a difference of 0.31%), Salvadoran (1.1%, a difference of 0.38%), Immigrants from Kazakhstan (1.1%, a difference of 0.74%), and Ecuadorian (1.1%, a difference of 0.78%).
| Demographics | Rating | Rank | Disability Age Under 5 |
| Immigrants | Congo | 99.8 /100 | #46 | Exceptional 1.1% |
| Immigrants | Sweden | 99.8 /100 | #47 | Exceptional 1.1% |
| Immigrants | Singapore | 99.7 /100 | #48 | Exceptional 1.1% |
| Immigrants | Russia | 99.7 /100 | #49 | Exceptional 1.1% |
| Immigrants | Japan | 99.7 /100 | #50 | Exceptional 1.1% |
| Immigrants | Kazakhstan | 99.7 /100 | #51 | Exceptional 1.1% |
| Immigrants | Bolivia | 99.6 /100 | #52 | Exceptional 1.1% |
| Asians | 99.6 /100 | #53 | Exceptional 1.1% |
| Immigrants | El Salvador | 99.6 /100 | #54 | Exceptional 1.1% |
| Salvadorans | 99.5 /100 | #55 | Exceptional 1.1% |
| Ecuadorians | 99.5 /100 | #56 | Exceptional 1.1% |
| Assyrians/Chaldeans/Syriacs | 99.5 /100 | #57 | Exceptional 1.1% |
| Immigrants | Egypt | 99.4 /100 | #58 | Exceptional 1.1% |
| Immigrants | Malaysia | 99.4 /100 | #59 | Exceptional 1.1% |
| Immigrants | Western Asia | 99.2 /100 | #60 | Exceptional 1.1% |