Spanish vs Asian Disability Age Under 5
COMPARE
Spanish
Asian
Disability Age Under 5
Disability Age Under 5 Comparison
Spanish
Asians
1.4%
DISABILITY AGE UNDER 5
0.2/ 100
METRIC RATING
263rd/ 347
METRIC RANK
1.1%
DISABILITY AGE UNDER 5
99.6/ 100
METRIC RATING
53rd/ 347
METRIC RANK
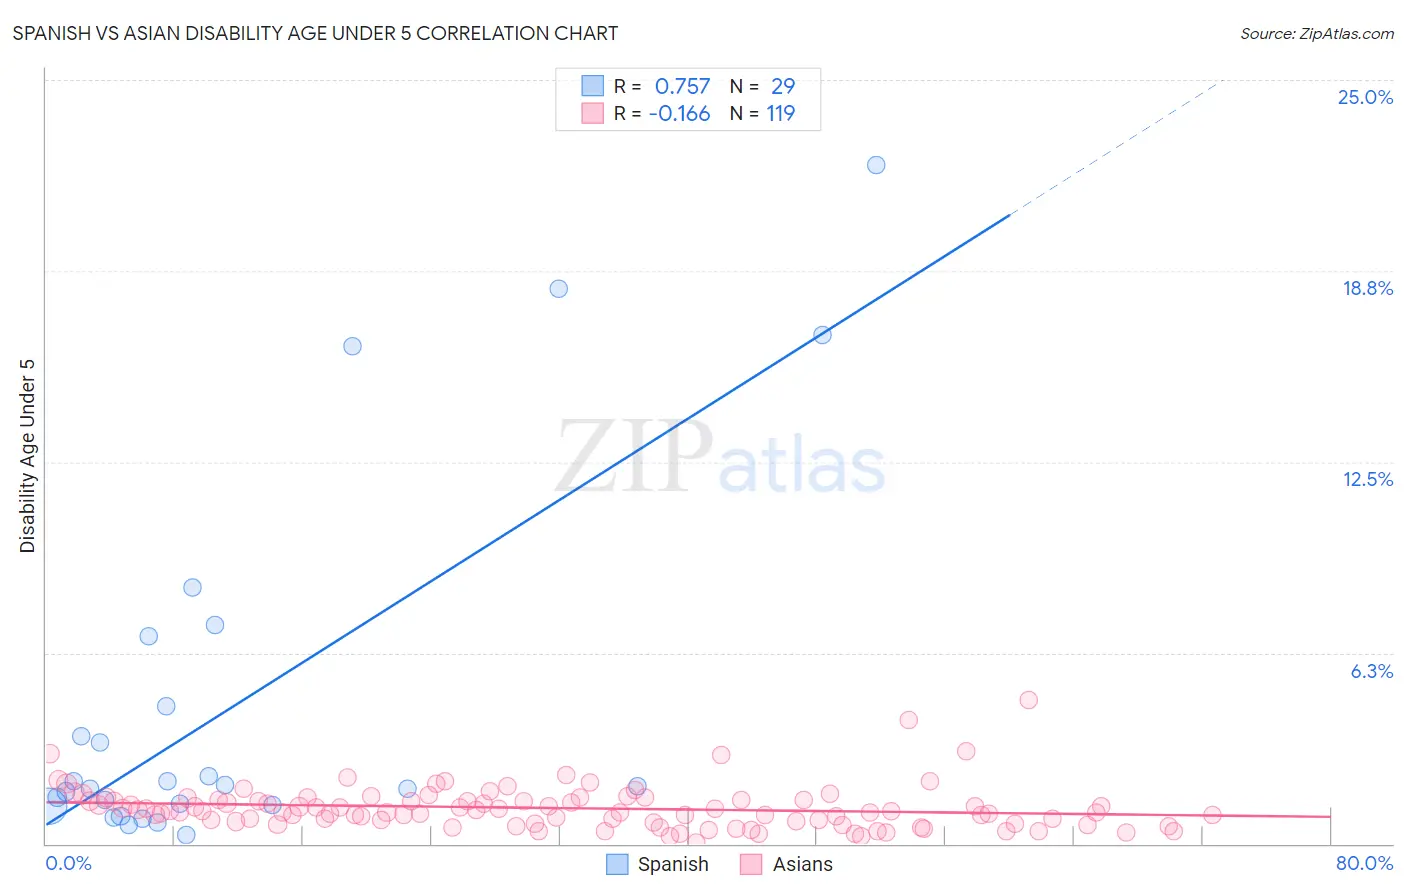
Spanish vs Asian Disability Age Under 5 Correlation Chart
The statistical analysis conducted on geographies consisting of 226,460,629 people shows a strong positive correlation between the proportion of Spanish and percentage of population with a disability under the age of 5 in the United States with a correlation coefficient (R) of 0.757 and weighted average of 1.4%. Similarly, the statistical analysis conducted on geographies consisting of 258,933,212 people shows a poor negative correlation between the proportion of Asians and percentage of population with a disability under the age of 5 in the United States with a correlation coefficient (R) of -0.166 and weighted average of 1.1%, a difference of 30.9%.
Disability Age Under 5 Correlation Summary
| Measurement | Spanish | Asian |
| Minimum | 0.27% | 0.058% |
| Maximum | 22.2% | 4.7% |
| Range | 21.9% | 4.7% |
| Mean | 4.6% | 1.2% |
| Median | 1.9% | 1.1% |
| Interquartile 25% (IQ1) | 1.2% | 0.73% |
| Interquartile 75% (IQ3) | 5.7% | 1.4% |
| Interquartile Range (IQR) | 4.4% | 0.69% |
| Standard Deviation (Sample) | 6.0% | 0.71% |
| Standard Deviation (Population) | 5.9% | 0.70% |
Similar Demographics by Disability Age Under 5
Demographics Similar to Spanish by Disability Age Under 5
In terms of disability age under 5, the demographic groups most similar to Spanish are Immigrants from Dominica (1.4%, a difference of 0.060%), Yugoslavian (1.4%, a difference of 0.15%), Carpatho Rusyn (1.4%, a difference of 0.19%), Immigrants from Netherlands (1.4%, a difference of 0.22%), and Immigrants from Germany (1.4%, a difference of 0.22%).
| Demographics | Rating | Rank | Disability Age Under 5 |
| Immigrants | Western Europe | 0.5 /100 | #256 | Tragic 1.4% |
| Slovenes | 0.3 /100 | #257 | Tragic 1.4% |
| Costa Ricans | 0.3 /100 | #258 | Tragic 1.4% |
| Immigrants | Southern Europe | 0.3 /100 | #259 | Tragic 1.4% |
| Slavs | 0.3 /100 | #260 | Tragic 1.4% |
| Immigrants | Netherlands | 0.2 /100 | #261 | Tragic 1.4% |
| Immigrants | Dominica | 0.2 /100 | #262 | Tragic 1.4% |
| Spanish | 0.2 /100 | #263 | Tragic 1.4% |
| Yugoslavians | 0.1 /100 | #264 | Tragic 1.4% |
| Carpatho Rusyns | 0.1 /100 | #265 | Tragic 1.4% |
| Immigrants | Germany | 0.1 /100 | #266 | Tragic 1.4% |
| Cree | 0.1 /100 | #267 | Tragic 1.4% |
| Belgians | 0.1 /100 | #268 | Tragic 1.4% |
| Austrians | 0.1 /100 | #269 | Tragic 1.4% |
| Immigrants | North America | 0.1 /100 | #270 | Tragic 1.4% |
Demographics Similar to Asians by Disability Age Under 5
In terms of disability age under 5, the demographic groups most similar to Asians are Immigrants from El Salvador (1.1%, a difference of 0.29%), Immigrants from Bolivia (1.1%, a difference of 0.31%), Salvadoran (1.1%, a difference of 0.38%), Immigrants from Kazakhstan (1.1%, a difference of 0.74%), and Ecuadorian (1.1%, a difference of 0.78%).
| Demographics | Rating | Rank | Disability Age Under 5 |
| Immigrants | Congo | 99.8 /100 | #46 | Exceptional 1.1% |
| Immigrants | Sweden | 99.8 /100 | #47 | Exceptional 1.1% |
| Immigrants | Singapore | 99.7 /100 | #48 | Exceptional 1.1% |
| Immigrants | Russia | 99.7 /100 | #49 | Exceptional 1.1% |
| Immigrants | Japan | 99.7 /100 | #50 | Exceptional 1.1% |
| Immigrants | Kazakhstan | 99.7 /100 | #51 | Exceptional 1.1% |
| Immigrants | Bolivia | 99.6 /100 | #52 | Exceptional 1.1% |
| Asians | 99.6 /100 | #53 | Exceptional 1.1% |
| Immigrants | El Salvador | 99.6 /100 | #54 | Exceptional 1.1% |
| Salvadorans | 99.5 /100 | #55 | Exceptional 1.1% |
| Ecuadorians | 99.5 /100 | #56 | Exceptional 1.1% |
| Assyrians/Chaldeans/Syriacs | 99.5 /100 | #57 | Exceptional 1.1% |
| Immigrants | Egypt | 99.4 /100 | #58 | Exceptional 1.1% |
| Immigrants | Malaysia | 99.4 /100 | #59 | Exceptional 1.1% |
| Immigrants | Western Asia | 99.2 /100 | #60 | Exceptional 1.1% |