Honduran vs Immigrants from Uganda Vision Disability
COMPARE
Honduran
Immigrants from Uganda
Vision Disability
Vision Disability Comparison
Hondurans
Immigrants from Uganda
2.5%
VISION DISABILITY
0.0/ 100
METRIC RATING
287th/ 347
METRIC RANK
2.1%
VISION DISABILITY
91.4/ 100
METRIC RATING
119th/ 347
METRIC RANK
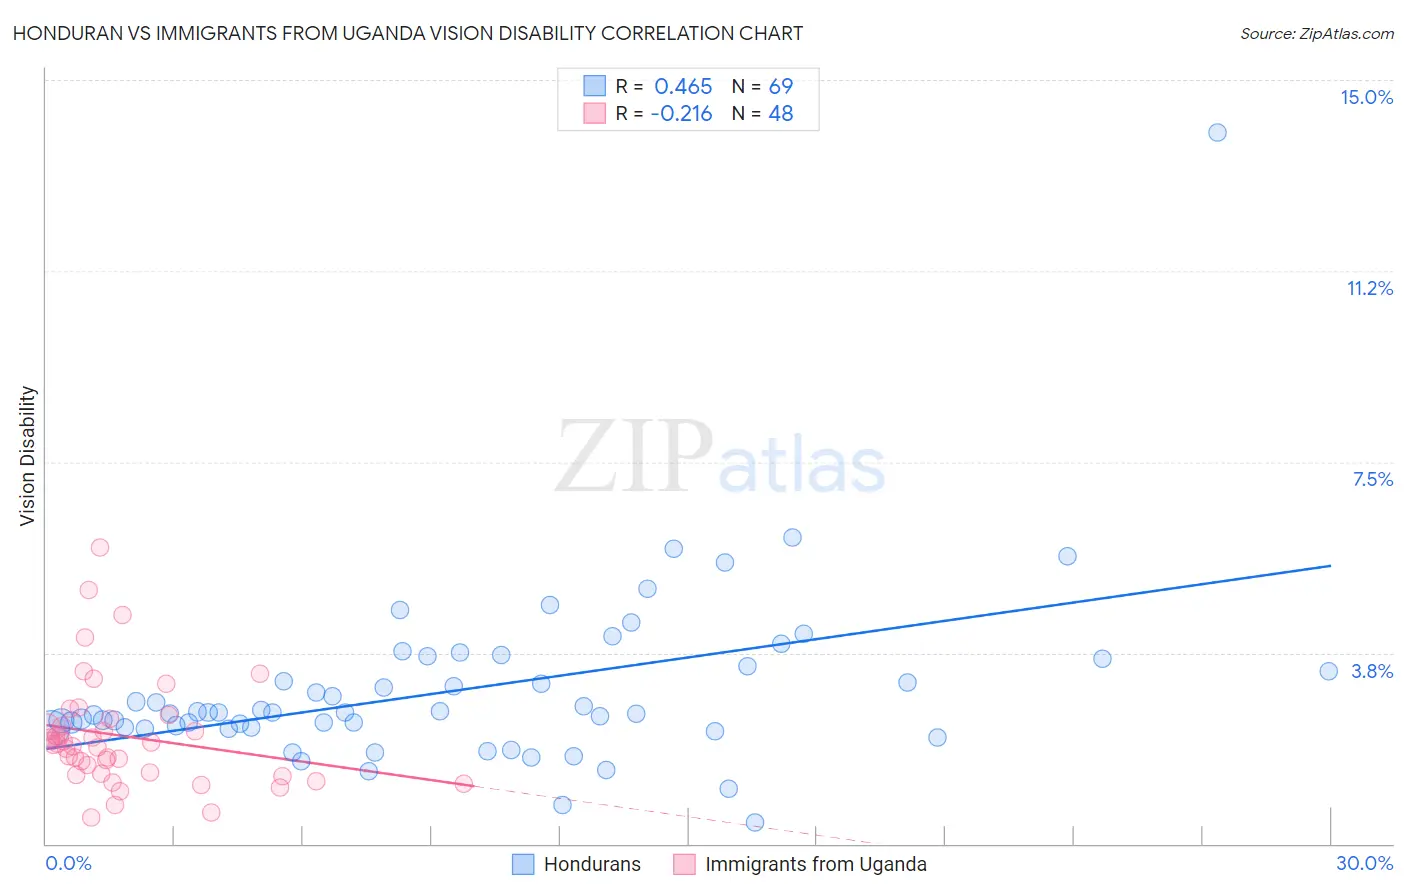
Honduran vs Immigrants from Uganda Vision Disability Correlation Chart
The statistical analysis conducted on geographies consisting of 357,659,584 people shows a moderate positive correlation between the proportion of Hondurans and percentage of population with vision disability in the United States with a correlation coefficient (R) of 0.465 and weighted average of 2.5%. Similarly, the statistical analysis conducted on geographies consisting of 125,949,603 people shows a weak negative correlation between the proportion of Immigrants from Uganda and percentage of population with vision disability in the United States with a correlation coefficient (R) of -0.216 and weighted average of 2.1%, a difference of 18.4%.
Vision Disability Correlation Summary
| Measurement | Honduran | Immigrants from Uganda |
| Minimum | 0.42% | 0.52% |
| Maximum | 14.0% | 5.8% |
| Range | 13.5% | 5.3% |
| Mean | 3.0% | 2.1% |
| Median | 2.6% | 2.0% |
| Interquartile 25% (IQ1) | 2.3% | 1.4% |
| Interquartile 75% (IQ3) | 3.6% | 2.4% |
| Interquartile Range (IQR) | 1.3% | 0.99% |
| Standard Deviation (Sample) | 1.8% | 1.1% |
| Standard Deviation (Population) | 1.7% | 1.1% |
Similar Demographics by Vision Disability
Demographics Similar to Hondurans by Vision Disability
In terms of vision disability, the demographic groups most similar to Hondurans are French American Indian (2.5%, a difference of 0.020%), Sioux (2.5%, a difference of 0.14%), Immigrants from Central America (2.5%, a difference of 0.15%), Yakama (2.5%, a difference of 0.17%), and Nonimmigrants (2.5%, a difference of 0.43%).
| Demographics | Rating | Rank | Vision Disability |
| Cape Verdeans | 0.0 /100 | #280 | Tragic 2.4% |
| U.S. Virgin Islanders | 0.0 /100 | #281 | Tragic 2.5% |
| Immigrants | Caribbean | 0.0 /100 | #282 | Tragic 2.5% |
| Puget Sound Salish | 0.0 /100 | #283 | Tragic 2.5% |
| Yakama | 0.0 /100 | #284 | Tragic 2.5% |
| Immigrants | Central America | 0.0 /100 | #285 | Tragic 2.5% |
| Sioux | 0.0 /100 | #286 | Tragic 2.5% |
| Hondurans | 0.0 /100 | #287 | Tragic 2.5% |
| French American Indians | 0.0 /100 | #288 | Tragic 2.5% |
| Immigrants | Nonimmigrants | 0.0 /100 | #289 | Tragic 2.5% |
| Immigrants | Cuba | 0.0 /100 | #290 | Tragic 2.5% |
| Immigrants | Honduras | 0.0 /100 | #291 | Tragic 2.5% |
| Crow | 0.0 /100 | #292 | Tragic 2.5% |
| Yaqui | 0.0 /100 | #293 | Tragic 2.5% |
| Ottawa | 0.0 /100 | #294 | Tragic 2.5% |
Demographics Similar to Immigrants from Uganda by Vision Disability
In terms of vision disability, the demographic groups most similar to Immigrants from Uganda are Immigrants from Philippines (2.1%, a difference of 0.0%), Immigrants from Zimbabwe (2.1%, a difference of 0.060%), Polish (2.1%, a difference of 0.14%), Ugandan (2.1%, a difference of 0.18%), and Immigrants from Vietnam (2.1%, a difference of 0.19%).
| Demographics | Rating | Rank | Vision Disability |
| Immigrants | Denmark | 92.9 /100 | #112 | Exceptional 2.1% |
| Kenyans | 92.5 /100 | #113 | Exceptional 2.1% |
| Croatians | 92.3 /100 | #114 | Exceptional 2.1% |
| Immigrants | Vietnam | 92.2 /100 | #115 | Exceptional 2.1% |
| Ugandans | 92.2 /100 | #116 | Exceptional 2.1% |
| Poles | 92.0 /100 | #117 | Exceptional 2.1% |
| Immigrants | Philippines | 91.4 /100 | #118 | Exceptional 2.1% |
| Immigrants | Uganda | 91.4 /100 | #119 | Exceptional 2.1% |
| Immigrants | Zimbabwe | 91.0 /100 | #120 | Exceptional 2.1% |
| Immigrants | Scotland | 90.4 /100 | #121 | Exceptional 2.1% |
| Immigrants | Ukraine | 90.4 /100 | #122 | Exceptional 2.1% |
| Immigrants | Albania | 90.4 /100 | #123 | Exceptional 2.1% |
| Immigrants | Spain | 89.8 /100 | #124 | Excellent 2.1% |
| Immigrants | Venezuela | 89.8 /100 | #125 | Excellent 2.1% |
| Immigrants | Peru | 89.5 /100 | #126 | Excellent 2.1% |