Honduran vs Immigrants from Fiji Vision Disability
COMPARE
Honduran
Immigrants from Fiji
Vision Disability
Vision Disability Comparison
Hondurans
Immigrants from Fiji
2.5%
VISION DISABILITY
0.0/ 100
METRIC RATING
287th/ 347
METRIC RANK
2.2%
VISION DISABILITY
47.6/ 100
METRIC RATING
175th/ 347
METRIC RANK
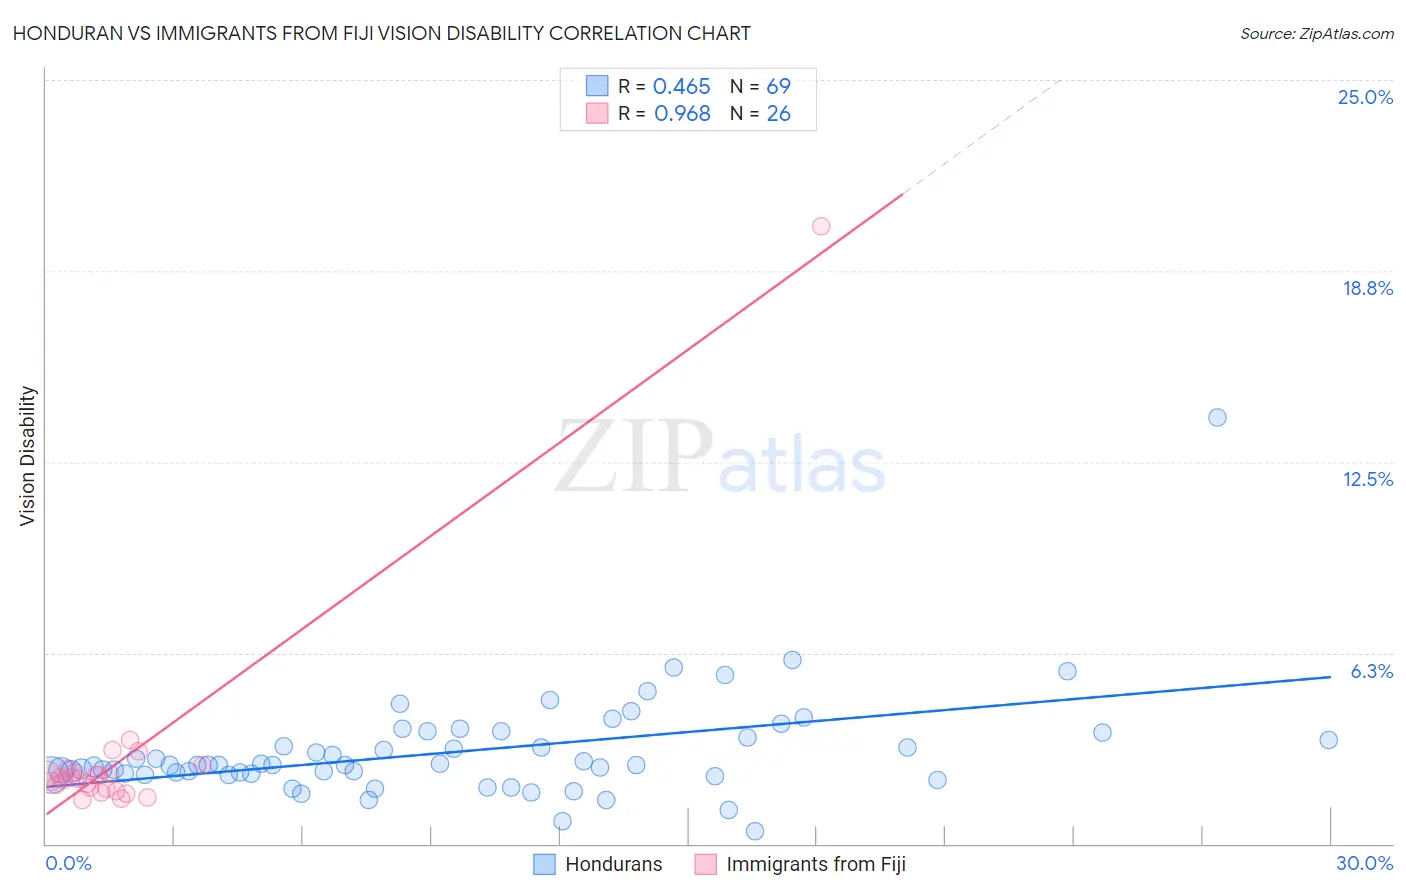
Honduran vs Immigrants from Fiji Vision Disability Correlation Chart
The statistical analysis conducted on geographies consisting of 357,659,584 people shows a moderate positive correlation between the proportion of Hondurans and percentage of population with vision disability in the United States with a correlation coefficient (R) of 0.465 and weighted average of 2.5%. Similarly, the statistical analysis conducted on geographies consisting of 93,750,153 people shows a perfect positive correlation between the proportion of Immigrants from Fiji and percentage of population with vision disability in the United States with a correlation coefficient (R) of 0.968 and weighted average of 2.2%, a difference of 13.8%.
Vision Disability Correlation Summary
| Measurement | Honduran | Immigrants from Fiji |
| Minimum | 0.42% | 1.4% |
| Maximum | 14.0% | 20.2% |
| Range | 13.5% | 18.8% |
| Mean | 3.0% | 2.8% |
| Median | 2.6% | 2.1% |
| Interquartile 25% (IQ1) | 2.3% | 1.8% |
| Interquartile 75% (IQ3) | 3.6% | 2.4% |
| Interquartile Range (IQR) | 1.3% | 0.56% |
| Standard Deviation (Sample) | 1.8% | 3.6% |
| Standard Deviation (Population) | 1.7% | 3.5% |
Similar Demographics by Vision Disability
Demographics Similar to Hondurans by Vision Disability
In terms of vision disability, the demographic groups most similar to Hondurans are French American Indian (2.5%, a difference of 0.020%), Sioux (2.5%, a difference of 0.14%), Immigrants from Central America (2.5%, a difference of 0.15%), Yakama (2.5%, a difference of 0.17%), and Nonimmigrants (2.5%, a difference of 0.43%).
| Demographics | Rating | Rank | Vision Disability |
| Cape Verdeans | 0.0 /100 | #280 | Tragic 2.4% |
| U.S. Virgin Islanders | 0.0 /100 | #281 | Tragic 2.5% |
| Immigrants | Caribbean | 0.0 /100 | #282 | Tragic 2.5% |
| Puget Sound Salish | 0.0 /100 | #283 | Tragic 2.5% |
| Yakama | 0.0 /100 | #284 | Tragic 2.5% |
| Immigrants | Central America | 0.0 /100 | #285 | Tragic 2.5% |
| Sioux | 0.0 /100 | #286 | Tragic 2.5% |
| Hondurans | 0.0 /100 | #287 | Tragic 2.5% |
| French American Indians | 0.0 /100 | #288 | Tragic 2.5% |
| Immigrants | Nonimmigrants | 0.0 /100 | #289 | Tragic 2.5% |
| Immigrants | Cuba | 0.0 /100 | #290 | Tragic 2.5% |
| Immigrants | Honduras | 0.0 /100 | #291 | Tragic 2.5% |
| Crow | 0.0 /100 | #292 | Tragic 2.5% |
| Yaqui | 0.0 /100 | #293 | Tragic 2.5% |
| Ottawa | 0.0 /100 | #294 | Tragic 2.5% |
Demographics Similar to Immigrants from Fiji by Vision Disability
In terms of vision disability, the demographic groups most similar to Immigrants from Fiji are Yugoslavian (2.2%, a difference of 0.070%), Slavic (2.2%, a difference of 0.11%), Scandinavian (2.2%, a difference of 0.15%), Immigrants from Canada (2.2%, a difference of 0.15%), and Northern European (2.2%, a difference of 0.16%).
| Demographics | Rating | Rank | Vision Disability |
| Brazilians | 62.2 /100 | #168 | Good 2.1% |
| South American Indians | 57.4 /100 | #169 | Average 2.2% |
| Swiss | 55.7 /100 | #170 | Average 2.2% |
| Lebanese | 54.3 /100 | #171 | Average 2.2% |
| Northern Europeans | 50.1 /100 | #172 | Average 2.2% |
| Scandinavians | 50.0 /100 | #173 | Average 2.2% |
| Immigrants | Canada | 50.0 /100 | #174 | Average 2.2% |
| Immigrants | Fiji | 47.6 /100 | #175 | Average 2.2% |
| Yugoslavians | 46.5 /100 | #176 | Average 2.2% |
| Slavs | 46.0 /100 | #177 | Average 2.2% |
| Immigrants | Oceania | 45.1 /100 | #178 | Average 2.2% |
| Immigrants | North America | 44.5 /100 | #179 | Average 2.2% |
| Uruguayans | 42.7 /100 | #180 | Average 2.2% |
| Immigrants | Western Europe | 41.1 /100 | #181 | Average 2.2% |
| Costa Ricans | 40.7 /100 | #182 | Average 2.2% |