Honduran vs Chippewa Female Unemployment
COMPARE
Honduran
Chippewa
Female Unemployment
Female Unemployment Comparison
Hondurans
Chippewa
5.9%
FEMALE UNEMPLOYMENT
0.0/ 100
METRIC RATING
268th/ 347
METRIC RANK
6.1%
FEMALE UNEMPLOYMENT
0.0/ 100
METRIC RATING
286th/ 347
METRIC RANK
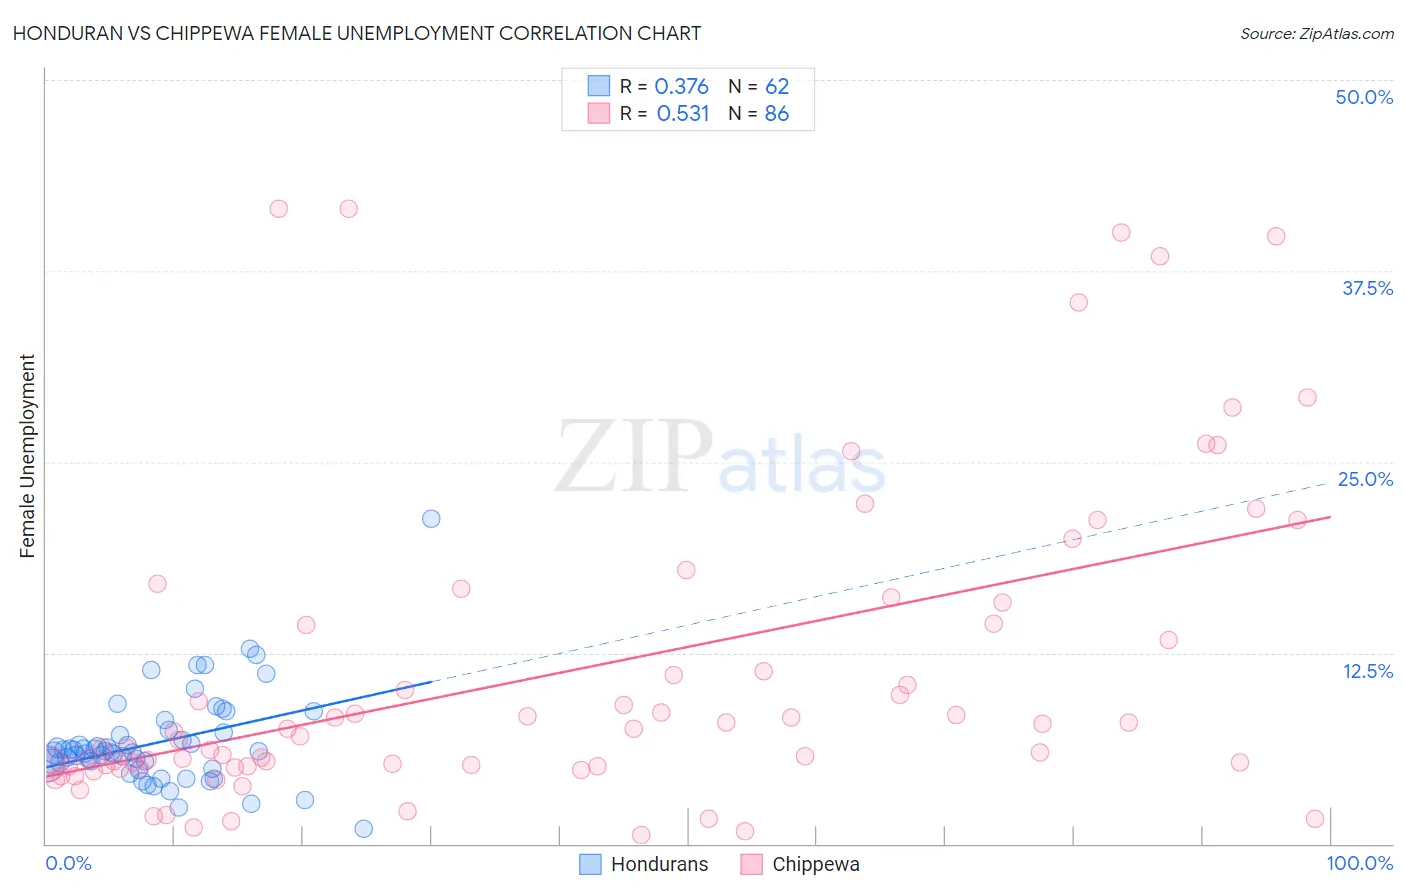
Honduran vs Chippewa Female Unemployment Correlation Chart
The statistical analysis conducted on geographies consisting of 356,669,168 people shows a mild positive correlation between the proportion of Hondurans and unemploymnet rate among females in the United States with a correlation coefficient (R) of 0.376 and weighted average of 5.9%. Similarly, the statistical analysis conducted on geographies consisting of 213,753,903 people shows a substantial positive correlation between the proportion of Chippewa and unemploymnet rate among females in the United States with a correlation coefficient (R) of 0.531 and weighted average of 6.1%, a difference of 3.3%.
Female Unemployment Correlation Summary
| Measurement | Honduran | Chippewa |
| Minimum | 1.0% | 0.60% |
| Maximum | 21.3% | 41.6% |
| Range | 20.3% | 41.0% |
| Mean | 6.6% | 11.2% |
| Median | 6.0% | 7.2% |
| Interquartile 25% (IQ1) | 5.2% | 5.1% |
| Interquartile 75% (IQ3) | 7.3% | 14.4% |
| Interquartile Range (IQR) | 2.1% | 9.3% |
| Standard Deviation (Sample) | 3.1% | 10.3% |
| Standard Deviation (Population) | 3.1% | 10.2% |
Demographics Similar to Hondurans and Chippewa by Female Unemployment
In terms of female unemployment, the demographic groups most similar to Hondurans are Nepalese (5.9%, a difference of 0.10%), Immigrants from Western Africa (5.9%, a difference of 0.20%), Immigrants from Honduras (5.9%, a difference of 0.61%), Central American (5.9%, a difference of 0.72%), and Lumbee (5.9%, a difference of 0.91%). Similarly, the demographic groups most similar to Chippewa are Immigrants from Cabo Verde (6.1%, a difference of 0.030%), Immigrants from Guatemala (6.1%, a difference of 0.030%), Immigrants from Senegal (6.1%, a difference of 0.40%), Salvadoran (6.0%, a difference of 0.74%), and Colville (6.0%, a difference of 0.84%).
| Demographics | Rating | Rank | Female Unemployment |
| Nepalese | 0.0 /100 | #267 | Tragic 5.9% |
| Hondurans | 0.0 /100 | #268 | Tragic 5.9% |
| Immigrants | Western Africa | 0.0 /100 | #269 | Tragic 5.9% |
| Immigrants | Honduras | 0.0 /100 | #270 | Tragic 5.9% |
| Central Americans | 0.0 /100 | #271 | Tragic 5.9% |
| Lumbee | 0.0 /100 | #272 | Tragic 5.9% |
| Ghanaians | 0.0 /100 | #273 | Tragic 5.9% |
| Africans | 0.0 /100 | #274 | Tragic 5.9% |
| Senegalese | 0.0 /100 | #275 | Tragic 6.0% |
| Bahamians | 0.0 /100 | #276 | Tragic 6.0% |
| Immigrants | Ghana | 0.0 /100 | #277 | Tragic 6.0% |
| Yaqui | 0.0 /100 | #278 | Tragic 6.0% |
| Armenians | 0.0 /100 | #279 | Tragic 6.0% |
| Mexican American Indians | 0.0 /100 | #280 | Tragic 6.0% |
| Guatemalans | 0.0 /100 | #281 | Tragic 6.0% |
| Colville | 0.0 /100 | #282 | Tragic 6.0% |
| Salvadorans | 0.0 /100 | #283 | Tragic 6.0% |
| Immigrants | Senegal | 0.0 /100 | #284 | Tragic 6.1% |
| Immigrants | Cabo Verde | 0.0 /100 | #285 | Tragic 6.1% |
| Chippewa | 0.0 /100 | #286 | Tragic 6.1% |
| Immigrants | Guatemala | 0.0 /100 | #287 | Tragic 6.1% |