Honduran vs Immigrants from Belgium Vision Disability
COMPARE
Honduran
Immigrants from Belgium
Vision Disability
Vision Disability Comparison
Hondurans
Immigrants from Belgium
2.5%
VISION DISABILITY
0.0/ 100
METRIC RATING
287th/ 347
METRIC RANK
2.0%
VISION DISABILITY
99.1/ 100
METRIC RATING
61st/ 347
METRIC RANK
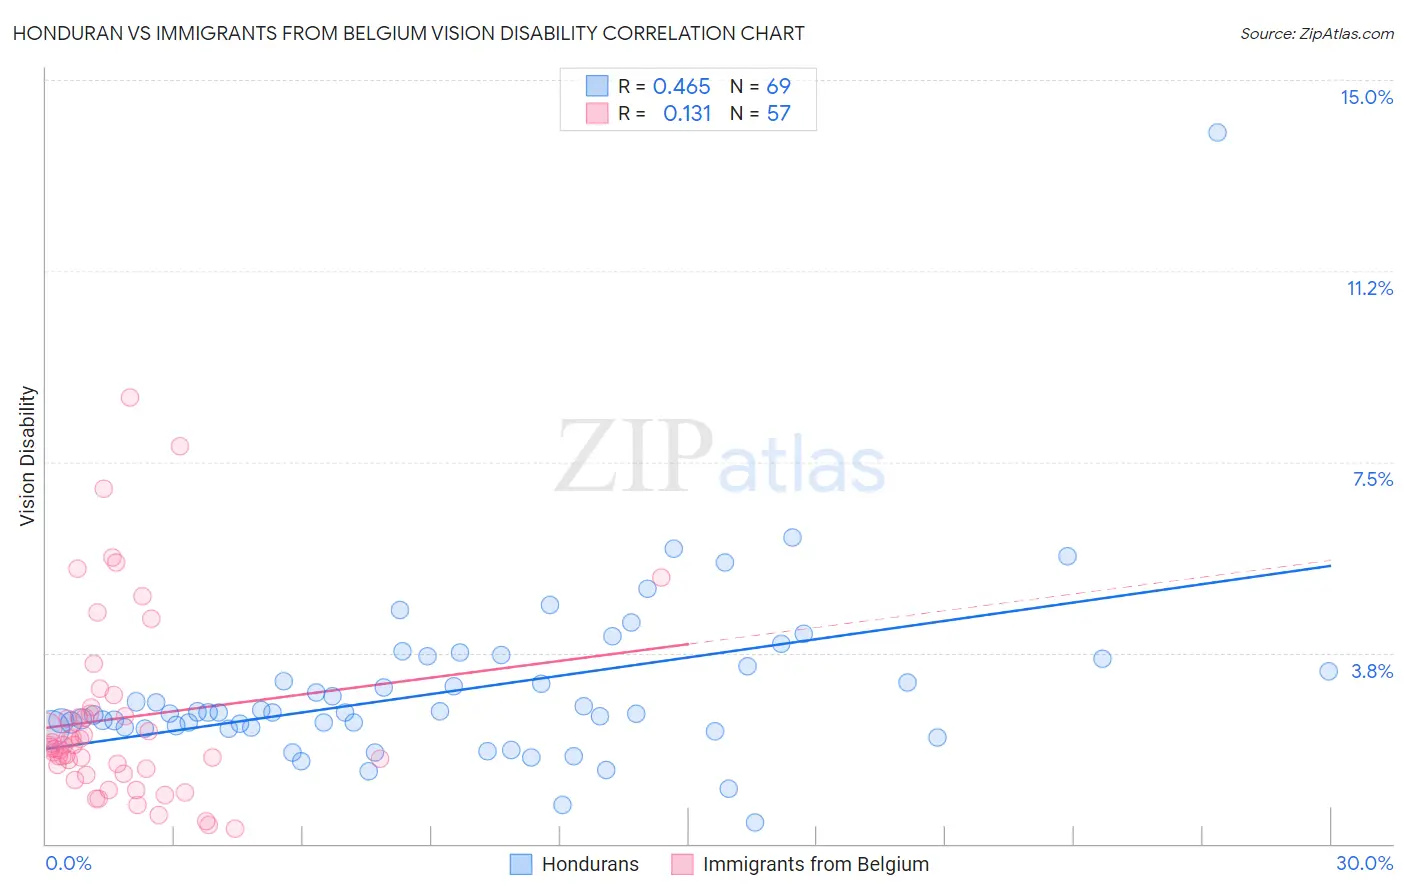
Honduran vs Immigrants from Belgium Vision Disability Correlation Chart
The statistical analysis conducted on geographies consisting of 357,659,584 people shows a moderate positive correlation between the proportion of Hondurans and percentage of population with vision disability in the United States with a correlation coefficient (R) of 0.465 and weighted average of 2.5%. Similarly, the statistical analysis conducted on geographies consisting of 146,674,933 people shows a poor positive correlation between the proportion of Immigrants from Belgium and percentage of population with vision disability in the United States with a correlation coefficient (R) of 0.131 and weighted average of 2.0%, a difference of 23.1%.
Vision Disability Correlation Summary
| Measurement | Honduran | Immigrants from Belgium |
| Minimum | 0.42% | 0.30% |
| Maximum | 14.0% | 8.8% |
| Range | 13.5% | 8.5% |
| Mean | 3.0% | 2.5% |
| Median | 2.6% | 1.9% |
| Interquartile 25% (IQ1) | 2.3% | 1.4% |
| Interquartile 75% (IQ3) | 3.6% | 2.6% |
| Interquartile Range (IQR) | 1.3% | 1.2% |
| Standard Deviation (Sample) | 1.8% | 1.8% |
| Standard Deviation (Population) | 1.7% | 1.8% |
Similar Demographics by Vision Disability
Demographics Similar to Hondurans by Vision Disability
In terms of vision disability, the demographic groups most similar to Hondurans are French American Indian (2.5%, a difference of 0.020%), Sioux (2.5%, a difference of 0.14%), Immigrants from Central America (2.5%, a difference of 0.15%), Yakama (2.5%, a difference of 0.17%), and Nonimmigrants (2.5%, a difference of 0.43%).
| Demographics | Rating | Rank | Vision Disability |
| Cape Verdeans | 0.0 /100 | #280 | Tragic 2.4% |
| U.S. Virgin Islanders | 0.0 /100 | #281 | Tragic 2.5% |
| Immigrants | Caribbean | 0.0 /100 | #282 | Tragic 2.5% |
| Puget Sound Salish | 0.0 /100 | #283 | Tragic 2.5% |
| Yakama | 0.0 /100 | #284 | Tragic 2.5% |
| Immigrants | Central America | 0.0 /100 | #285 | Tragic 2.5% |
| Sioux | 0.0 /100 | #286 | Tragic 2.5% |
| Hondurans | 0.0 /100 | #287 | Tragic 2.5% |
| French American Indians | 0.0 /100 | #288 | Tragic 2.5% |
| Immigrants | Nonimmigrants | 0.0 /100 | #289 | Tragic 2.5% |
| Immigrants | Cuba | 0.0 /100 | #290 | Tragic 2.5% |
| Immigrants | Honduras | 0.0 /100 | #291 | Tragic 2.5% |
| Crow | 0.0 /100 | #292 | Tragic 2.5% |
| Yaqui | 0.0 /100 | #293 | Tragic 2.5% |
| Ottawa | 0.0 /100 | #294 | Tragic 2.5% |
Demographics Similar to Immigrants from Belgium by Vision Disability
In terms of vision disability, the demographic groups most similar to Immigrants from Belgium are Immigrants from Romania (2.0%, a difference of 0.010%), Immigrants from Russia (2.0%, a difference of 0.020%), Argentinean (2.0%, a difference of 0.040%), Armenian (2.0%, a difference of 0.13%), and Immigrants from Saudi Arabia (2.0%, a difference of 0.18%).
| Demographics | Rating | Rank | Vision Disability |
| Macedonians | 99.3 /100 | #54 | Exceptional 2.0% |
| Laotians | 99.3 /100 | #55 | Exceptional 2.0% |
| Jordanians | 99.2 /100 | #56 | Exceptional 2.0% |
| Somalis | 99.2 /100 | #57 | Exceptional 2.0% |
| Immigrants | Saudi Arabia | 99.2 /100 | #58 | Exceptional 2.0% |
| Argentineans | 99.1 /100 | #59 | Exceptional 2.0% |
| Immigrants | Romania | 99.1 /100 | #60 | Exceptional 2.0% |
| Immigrants | Belgium | 99.1 /100 | #61 | Exceptional 2.0% |
| Immigrants | Russia | 99.1 /100 | #62 | Exceptional 2.0% |
| Armenians | 99.0 /100 | #63 | Exceptional 2.0% |
| Immigrants | Greece | 99.0 /100 | #64 | Exceptional 2.0% |
| Maltese | 98.9 /100 | #65 | Exceptional 2.0% |
| Immigrants | Argentina | 98.9 /100 | #66 | Exceptional 2.0% |
| Immigrants | Northern Africa | 98.8 /100 | #67 | Exceptional 2.0% |
| Immigrants | Czechoslovakia | 98.7 /100 | #68 | Exceptional 2.0% |