Hmong vs Yugoslavian Family Households
COMPARE
Hmong
Yugoslavian
Family Households
Family Households Comparison
Hmong
Yugoslavians
64.9%
FAMILY HOUSEHOLDS
93.4/ 100
METRIC RATING
122nd/ 347
METRIC RANK
63.1%
FAMILY HOUSEHOLDS
0.4/ 100
METRIC RATING
269th/ 347
METRIC RANK
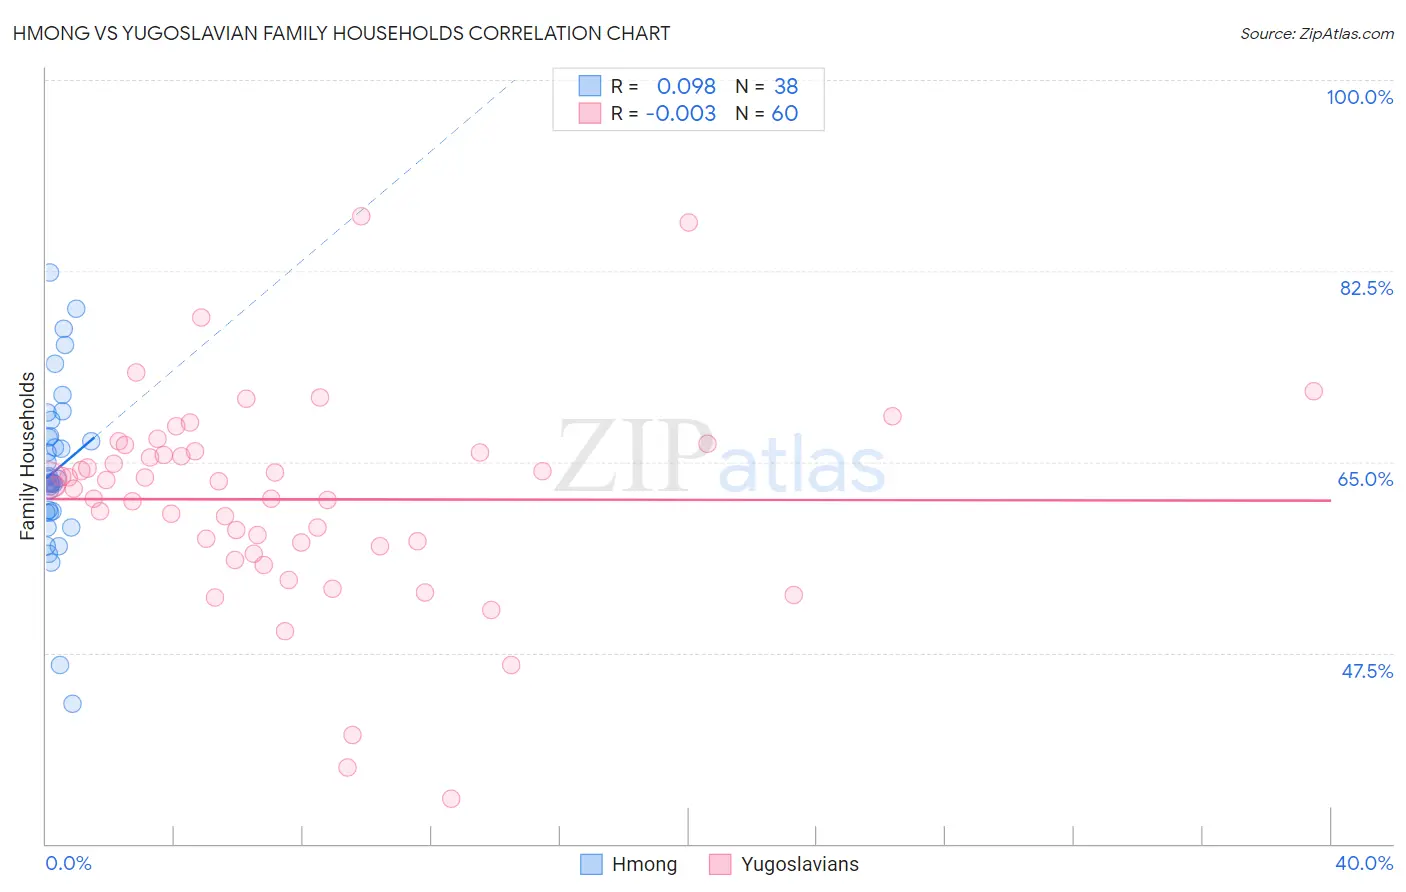
Hmong vs Yugoslavian Family Households Correlation Chart
The statistical analysis conducted on geographies consisting of 24,604,422 people shows a slight positive correlation between the proportion of Hmong and percentage of family households in the United States with a correlation coefficient (R) of 0.098 and weighted average of 64.9%. Similarly, the statistical analysis conducted on geographies consisting of 285,640,029 people shows no correlation between the proportion of Yugoslavians and percentage of family households in the United States with a correlation coefficient (R) of -0.003 and weighted average of 63.1%, a difference of 2.8%.
Family Households Correlation Summary
| Measurement | Hmong | Yugoslavian |
| Minimum | 42.8% | 34.1% |
| Maximum | 82.3% | 87.5% |
| Range | 39.5% | 53.4% |
| Mean | 64.2% | 61.6% |
| Median | 63.3% | 62.9% |
| Interquartile 25% (IQ1) | 60.4% | 57.5% |
| Interquartile 75% (IQ3) | 67.3% | 65.9% |
| Interquartile Range (IQR) | 6.9% | 8.5% |
| Standard Deviation (Sample) | 7.8% | 9.4% |
| Standard Deviation (Population) | 7.7% | 9.4% |
Similar Demographics by Family Households
Demographics Similar to Hmong by Family Households
In terms of family households, the demographic groups most similar to Hmong are Choctaw (64.9%, a difference of 0.0%), Immigrants from Argentina (64.9%, a difference of 0.030%), Immigrants from Belize (64.9%, a difference of 0.030%), Hungarian (64.9%, a difference of 0.040%), and Immigrants from Oceania (64.9%, a difference of 0.050%).
| Demographics | Rating | Rank | Family Households |
| Ecuadorians | 95.4 /100 | #115 | Exceptional 65.0% |
| Immigrants | Iraq | 95.4 /100 | #116 | Exceptional 65.0% |
| Cherokee | 95.3 /100 | #117 | Exceptional 65.0% |
| Dutch | 95.1 /100 | #118 | Exceptional 64.9% |
| Immigrants | Eastern Asia | 94.4 /100 | #119 | Exceptional 64.9% |
| Immigrants | Oceania | 94.2 /100 | #120 | Exceptional 64.9% |
| Hungarians | 94.0 /100 | #121 | Exceptional 64.9% |
| Hmong | 93.4 /100 | #122 | Exceptional 64.9% |
| Choctaw | 93.4 /100 | #123 | Exceptional 64.9% |
| Immigrants | Argentina | 92.8 /100 | #124 | Exceptional 64.9% |
| Immigrants | Belize | 92.7 /100 | #125 | Exceptional 64.9% |
| Panamanians | 92.4 /100 | #126 | Exceptional 64.8% |
| Immigrants | Panama | 92.0 /100 | #127 | Exceptional 64.8% |
| Italians | 91.9 /100 | #128 | Exceptional 64.8% |
| Immigrants | Ecuador | 91.4 /100 | #129 | Exceptional 64.8% |
Demographics Similar to Yugoslavians by Family Households
In terms of family households, the demographic groups most similar to Yugoslavians are Immigrants from Singapore (63.1%, a difference of 0.0%), Immigrants from Austria (63.1%, a difference of 0.020%), Immigrants from Croatia (63.1%, a difference of 0.030%), Immigrants from Turkey (63.1%, a difference of 0.030%), and Immigrants from Kazakhstan (63.1%, a difference of 0.040%).
| Demographics | Rating | Rank | Family Households |
| Immigrants | Ireland | 0.6 /100 | #262 | Tragic 63.2% |
| Cheyenne | 0.5 /100 | #263 | Tragic 63.2% |
| Kenyans | 0.5 /100 | #264 | Tragic 63.2% |
| Colville | 0.5 /100 | #265 | Tragic 63.2% |
| Immigrants | Western Africa | 0.5 /100 | #266 | Tragic 63.1% |
| Israelis | 0.4 /100 | #267 | Tragic 63.1% |
| Immigrants | Singapore | 0.4 /100 | #268 | Tragic 63.1% |
| Yugoslavians | 0.4 /100 | #269 | Tragic 63.1% |
| Immigrants | Austria | 0.3 /100 | #270 | Tragic 63.1% |
| Immigrants | Croatia | 0.3 /100 | #271 | Tragic 63.1% |
| Immigrants | Turkey | 0.3 /100 | #272 | Tragic 63.1% |
| Immigrants | Kazakhstan | 0.3 /100 | #273 | Tragic 63.1% |
| Lumbee | 0.3 /100 | #274 | Tragic 63.1% |
| West Indians | 0.3 /100 | #275 | Tragic 63.1% |
| Serbians | 0.3 /100 | #276 | Tragic 63.0% |