Hmong vs Yugoslavian Child Poverty Under the Age of 16
COMPARE
Hmong
Yugoslavian
Child Poverty Under the Age of 16
Child Poverty Under the Age of 16 Comparison
Hmong
Yugoslavians
17.1%
CHILD POVERTY UNDER THE AGE OF 16
14.0/ 100
METRIC RATING
204th/ 347
METRIC RANK
15.8%
CHILD POVERTY UNDER THE AGE OF 16
67.6/ 100
METRIC RATING
163rd/ 347
METRIC RANK
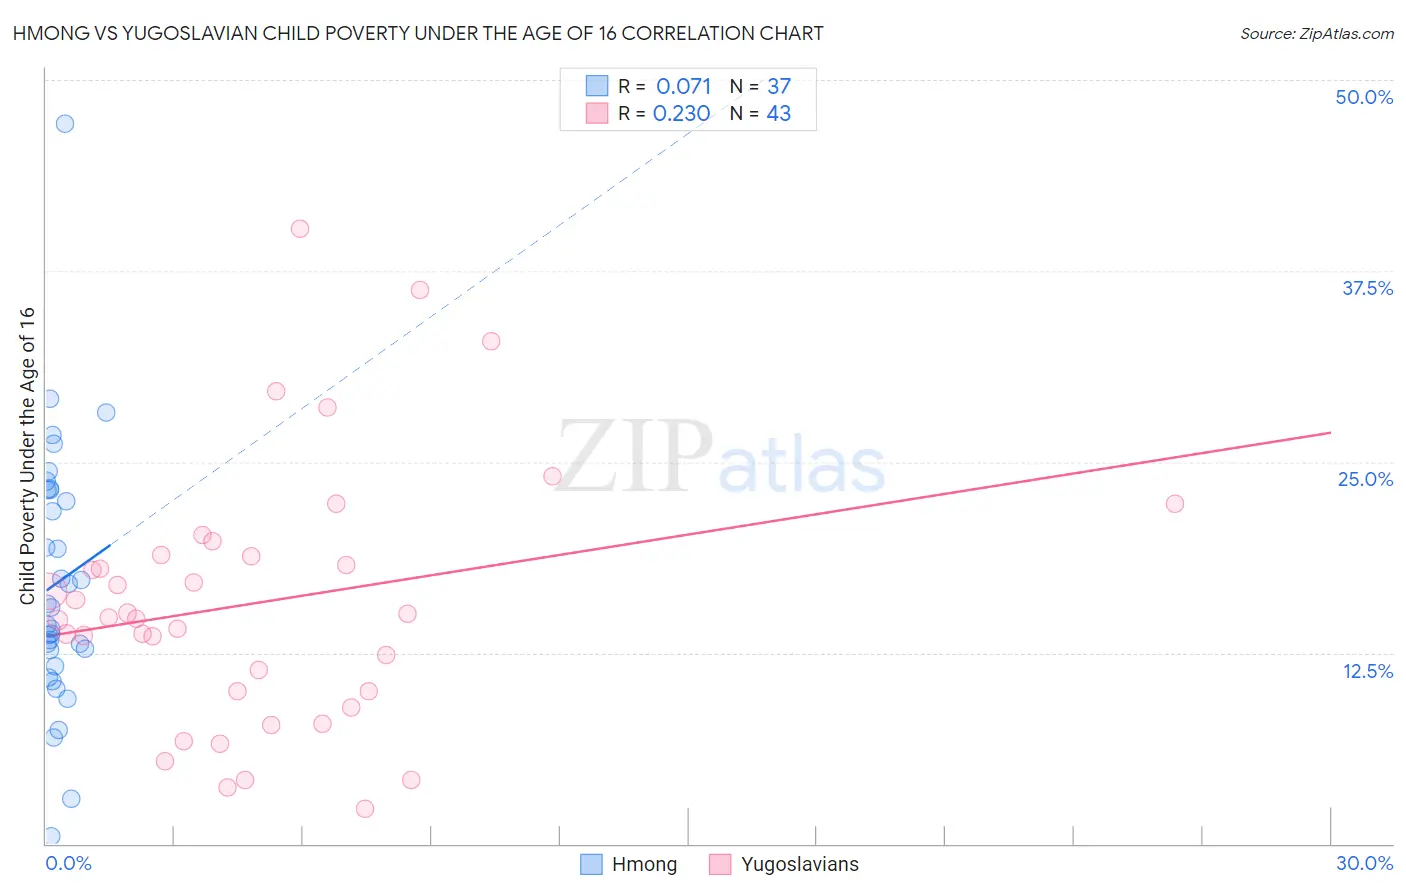
Hmong vs Yugoslavian Child Poverty Under the Age of 16 Correlation Chart
The statistical analysis conducted on geographies consisting of 24,652,508 people shows a slight positive correlation between the proportion of Hmong and poverty level among children under the age of 16 in the United States with a correlation coefficient (R) of 0.071 and weighted average of 17.1%. Similarly, the statistical analysis conducted on geographies consisting of 283,940,163 people shows a weak positive correlation between the proportion of Yugoslavians and poverty level among children under the age of 16 in the United States with a correlation coefficient (R) of 0.230 and weighted average of 15.8%, a difference of 7.8%.
Child Poverty Under the Age of 16 Correlation Summary
| Measurement | Hmong | Yugoslavian |
| Minimum | 0.48% | 2.3% |
| Maximum | 47.2% | 40.2% |
| Range | 46.7% | 37.9% |
| Mean | 17.1% | 15.8% |
| Median | 15.5% | 14.8% |
| Interquartile 25% (IQ1) | 12.1% | 10.0% |
| Interquartile 75% (IQ3) | 23.2% | 18.9% |
| Interquartile Range (IQR) | 11.0% | 8.9% |
| Standard Deviation (Sample) | 8.6% | 8.5% |
| Standard Deviation (Population) | 8.4% | 8.4% |
Similar Demographics by Child Poverty Under the Age of 16
Demographics Similar to Hmong by Child Poverty Under the Age of 16
In terms of child poverty under the age of 16, the demographic groups most similar to Hmong are Aleut (17.1%, a difference of 0.010%), Immigrants from Sierra Leone (17.1%, a difference of 0.060%), Ugandan (17.1%, a difference of 0.080%), Immigrants from Uzbekistan (17.1%, a difference of 0.16%), and Immigrants from Cameroon (17.1%, a difference of 0.17%).
| Demographics | Rating | Rank | Child Poverty Under the Age of 16 |
| Immigrants | Kenya | 19.1 /100 | #197 | Poor 16.9% |
| Delaware | 17.1 /100 | #198 | Poor 17.0% |
| Immigrants | Afghanistan | 15.1 /100 | #199 | Poor 17.0% |
| Immigrants | Cameroon | 14.7 /100 | #200 | Poor 17.1% |
| Immigrants | Uzbekistan | 14.7 /100 | #201 | Poor 17.1% |
| Ugandans | 14.3 /100 | #202 | Poor 17.1% |
| Immigrants | Sierra Leone | 14.2 /100 | #203 | Poor 17.1% |
| Hmong | 14.0 /100 | #204 | Poor 17.1% |
| Aleuts | 13.9 /100 | #205 | Poor 17.1% |
| Alaska Natives | 11.8 /100 | #206 | Poor 17.2% |
| German Russians | 8.6 /100 | #207 | Tragic 17.4% |
| Pennsylvania Germans | 7.5 /100 | #208 | Tragic 17.4% |
| Panamanians | 6.9 /100 | #209 | Tragic 17.5% |
| Alaskan Athabascans | 6.9 /100 | #210 | Tragic 17.5% |
| Immigrants | Thailand | 6.6 /100 | #211 | Tragic 17.5% |
Demographics Similar to Yugoslavians by Child Poverty Under the Age of 16
In terms of child poverty under the age of 16, the demographic groups most similar to Yugoslavians are Colombian (15.8%, a difference of 0.0%), Immigrants from Germany (15.8%, a difference of 0.040%), Immigrants from Northern Africa (15.8%, a difference of 0.060%), Guamanian/Chamorro (15.9%, a difference of 0.17%), and Immigrants from Oceania (15.9%, a difference of 0.30%).
| Demographics | Rating | Rank | Child Poverty Under the Age of 16 |
| Immigrants | Venezuela | 74.9 /100 | #156 | Good 15.7% |
| Immigrants | Nepal | 72.9 /100 | #157 | Good 15.7% |
| Immigrants | Chile | 72.8 /100 | #158 | Good 15.7% |
| Immigrants | Fiji | 71.1 /100 | #159 | Good 15.8% |
| Immigrants | Albania | 70.7 /100 | #160 | Good 15.8% |
| Immigrants | Northern Africa | 68.1 /100 | #161 | Good 15.8% |
| Colombians | 67.6 /100 | #162 | Good 15.8% |
| Yugoslavians | 67.6 /100 | #163 | Good 15.8% |
| Immigrants | Germany | 67.3 /100 | #164 | Good 15.8% |
| Guamanians/Chamorros | 66.4 /100 | #165 | Good 15.9% |
| Immigrants | Oceania | 65.4 /100 | #166 | Good 15.9% |
| Costa Ricans | 61.1 /100 | #167 | Good 16.0% |
| South Americans | 57.9 /100 | #168 | Average 16.0% |
| Uruguayans | 54.7 /100 | #169 | Average 16.1% |
| Immigrants | Colombia | 54.4 /100 | #170 | Average 16.1% |