Hmong vs Immigrants from South America Disability
COMPARE
Hmong
Immigrants from South America
Disability
Disability Comparison
Hmong
Immigrants from South America
12.8%
DISABILITY
0.0/ 100
METRIC RATING
276th/ 347
METRIC RANK
10.9%
DISABILITY
99.8/ 100
METRIC RATING
58th/ 347
METRIC RANK
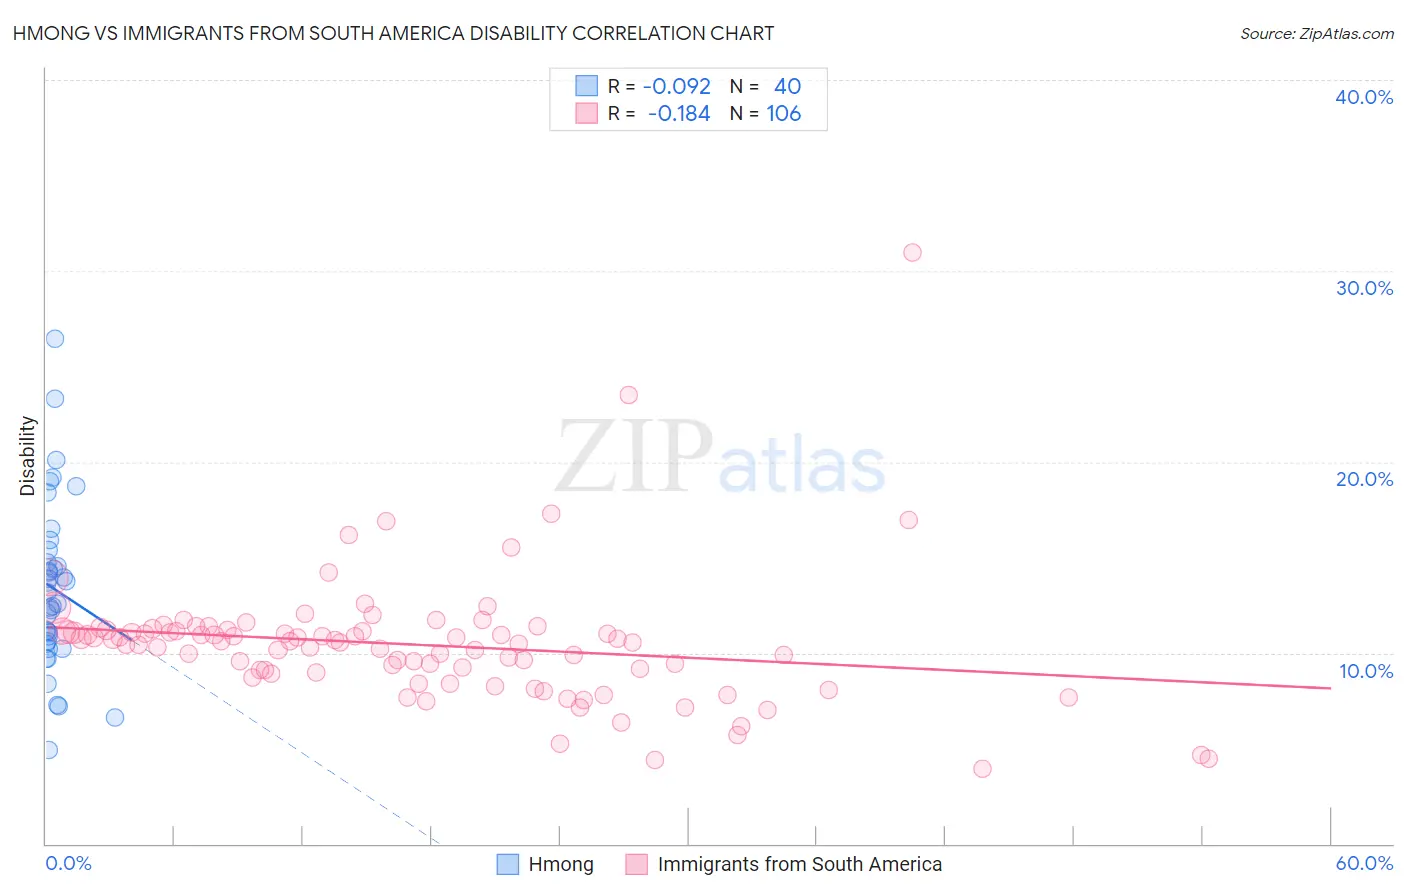
Hmong vs Immigrants from South America Disability Correlation Chart
The statistical analysis conducted on geographies consisting of 24,681,537 people shows a slight negative correlation between the proportion of Hmong and percentage of population with a disability in the United States with a correlation coefficient (R) of -0.092 and weighted average of 12.8%. Similarly, the statistical analysis conducted on geographies consisting of 486,347,042 people shows a poor negative correlation between the proportion of Immigrants from South America and percentage of population with a disability in the United States with a correlation coefficient (R) of -0.184 and weighted average of 10.9%, a difference of 17.2%.
Disability Correlation Summary
| Measurement | Hmong | Immigrants from South America |
| Minimum | 4.9% | 3.9% |
| Maximum | 26.4% | 31.0% |
| Range | 21.5% | 27.0% |
| Mean | 13.4% | 10.4% |
| Median | 12.8% | 10.6% |
| Interquartile 25% (IQ1) | 10.5% | 9.0% |
| Interquartile 75% (IQ3) | 15.1% | 11.2% |
| Interquartile Range (IQR) | 4.5% | 2.2% |
| Standard Deviation (Sample) | 4.4% | 3.4% |
| Standard Deviation (Population) | 4.4% | 3.4% |
Similar Demographics by Disability
Demographics Similar to Hmong by Disability
In terms of disability, the demographic groups most similar to Hmong are Dutch (12.8%, a difference of 0.050%), Sioux (12.8%, a difference of 0.15%), German (12.8%, a difference of 0.22%), Nepalese (12.8%, a difference of 0.23%), and Fijian (12.8%, a difference of 0.31%).
| Demographics | Rating | Rank | Disability |
| Immigrants | Dominican Republic | 0.1 /100 | #269 | Tragic 12.6% |
| Portuguese | 0.1 /100 | #270 | Tragic 12.6% |
| Immigrants | Yemen | 0.1 /100 | #271 | Tragic 12.6% |
| Dominicans | 0.0 /100 | #272 | Tragic 12.7% |
| Finns | 0.0 /100 | #273 | Tragic 12.7% |
| Nepalese | 0.0 /100 | #274 | Tragic 12.8% |
| Sioux | 0.0 /100 | #275 | Tragic 12.8% |
| Hmong | 0.0 /100 | #276 | Tragic 12.8% |
| Dutch | 0.0 /100 | #277 | Tragic 12.8% |
| Germans | 0.0 /100 | #278 | Tragic 12.8% |
| Fijians | 0.0 /100 | #279 | Tragic 12.8% |
| Spanish | 0.0 /100 | #280 | Tragic 12.8% |
| Immigrants | Portugal | 0.0 /100 | #281 | Tragic 12.9% |
| Scottish | 0.0 /100 | #282 | Tragic 12.9% |
| Irish | 0.0 /100 | #283 | Tragic 12.9% |
Demographics Similar to Immigrants from South America by Disability
In terms of disability, the demographic groups most similar to Immigrants from South America are Salvadoran (10.9%, a difference of 0.030%), Immigrants from Colombia (10.9%, a difference of 0.090%), Zimbabwean (10.9%, a difference of 0.18%), Immigrants from Bulgaria (10.9%, a difference of 0.24%), and Immigrants from Lithuania (10.9%, a difference of 0.27%).
| Demographics | Rating | Rank | Disability |
| Peruvians | 99.8 /100 | #51 | Exceptional 10.9% |
| South Americans | 99.8 /100 | #52 | Exceptional 10.9% |
| Immigrants | Spain | 99.8 /100 | #53 | Exceptional 10.9% |
| Jordanians | 99.8 /100 | #54 | Exceptional 10.9% |
| Immigrants | El Salvador | 99.8 /100 | #55 | Exceptional 10.9% |
| Immigrants | Lithuania | 99.8 /100 | #56 | Exceptional 10.9% |
| Salvadorans | 99.8 /100 | #57 | Exceptional 10.9% |
| Immigrants | South America | 99.8 /100 | #58 | Exceptional 10.9% |
| Immigrants | Colombia | 99.7 /100 | #59 | Exceptional 10.9% |
| Zimbabweans | 99.7 /100 | #60 | Exceptional 10.9% |
| Immigrants | Bulgaria | 99.7 /100 | #61 | Exceptional 10.9% |
| Immigrants | Northern Africa | 99.7 /100 | #62 | Exceptional 10.9% |
| Immigrants | Eritrea | 99.7 /100 | #63 | Exceptional 11.0% |
| Immigrants | Sweden | 99.6 /100 | #64 | Exceptional 11.0% |
| Bulgarians | 99.6 /100 | #65 | Exceptional 11.0% |