Hawaiian vs Immigrants from Central America 4th Grade
COMPARE
Hawaiian
Immigrants from Central America
4th Grade
4th Grade Comparison
Hawaiians
Immigrants from Central America
97.4%
4TH GRADE
25.6/ 100
METRIC RATING
197th/ 347
METRIC RANK
95.1%
4TH GRADE
0.0/ 100
METRIC RATING
342nd/ 347
METRIC RANK
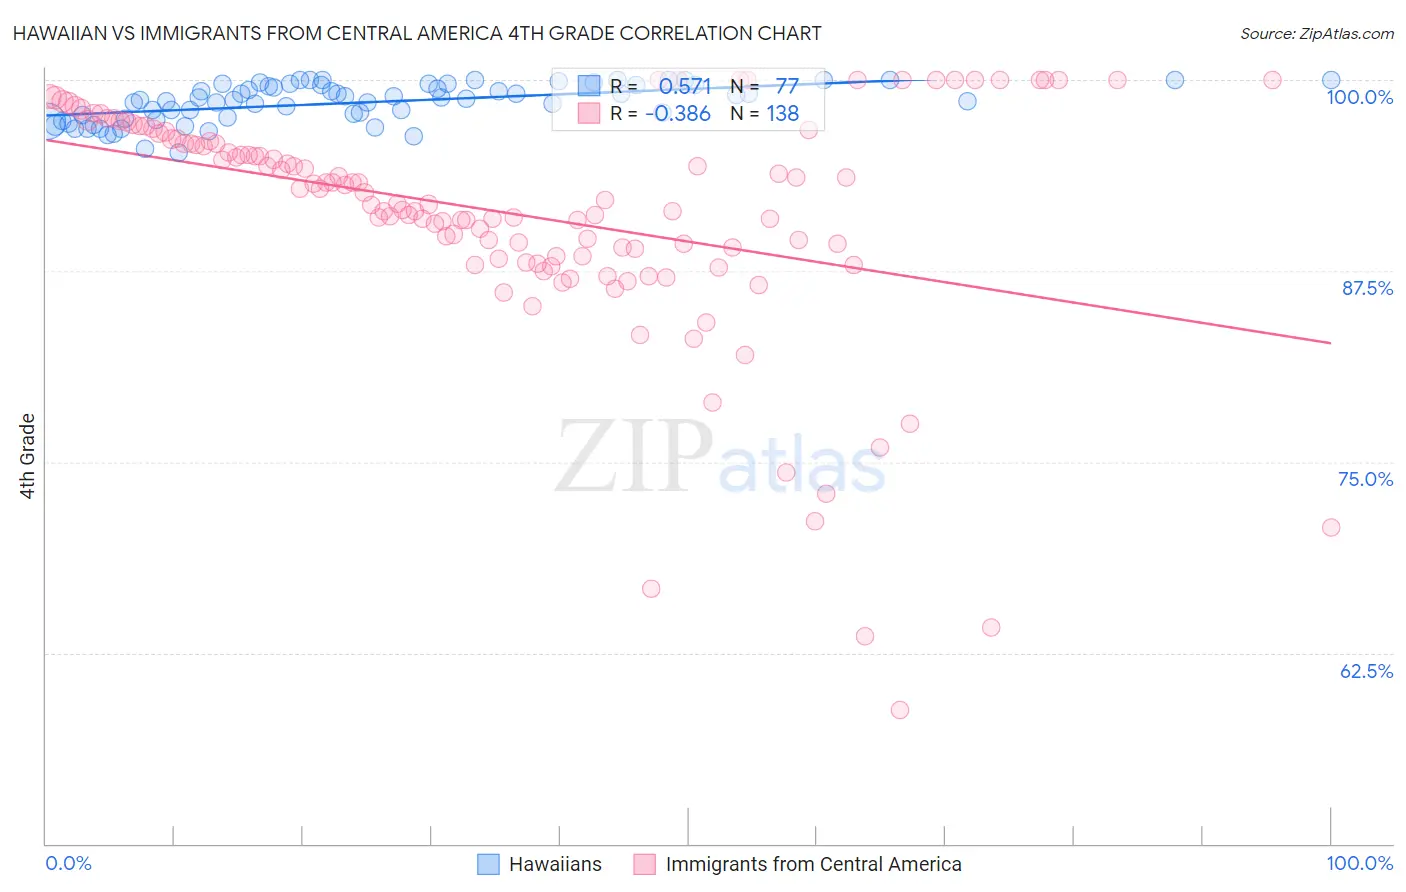
Hawaiian vs Immigrants from Central America 4th Grade Correlation Chart
The statistical analysis conducted on geographies consisting of 327,621,279 people shows a substantial positive correlation between the proportion of Hawaiians and percentage of population with at least 4th grade education in the United States with a correlation coefficient (R) of 0.571 and weighted average of 97.4%. Similarly, the statistical analysis conducted on geographies consisting of 536,554,667 people shows a mild negative correlation between the proportion of Immigrants from Central America and percentage of population with at least 4th grade education in the United States with a correlation coefficient (R) of -0.386 and weighted average of 95.1%, a difference of 2.4%.
4th Grade Correlation Summary
| Measurement | Hawaiian | Immigrants from Central America |
| Minimum | 95.3% | 58.8% |
| Maximum | 100.0% | 100.0% |
| Range | 4.7% | 41.2% |
| Mean | 98.5% | 91.3% |
| Median | 98.7% | 92.8% |
| Interquartile 25% (IQ1) | 97.5% | 88.5% |
| Interquartile 75% (IQ3) | 99.7% | 96.5% |
| Interquartile Range (IQR) | 2.2% | 8.0% |
| Standard Deviation (Sample) | 1.2% | 7.7% |
| Standard Deviation (Population) | 1.2% | 7.7% |
Similar Demographics by 4th Grade
Demographics Similar to Hawaiians by 4th Grade
In terms of 4th grade, the demographic groups most similar to Hawaiians are Immigrants from Albania (97.4%, a difference of 0.010%), Guamanian/Chamorro (97.4%, a difference of 0.010%), Navajo (97.4%, a difference of 0.020%), Immigrants from Ukraine (97.4%, a difference of 0.020%), and Immigrants from Egypt (97.4%, a difference of 0.020%).
| Demographics | Rating | Rank | 4th Grade |
| Blacks/African Americans | 31.1 /100 | #190 | Fair 97.4% |
| Navajo | 30.7 /100 | #191 | Fair 97.4% |
| Immigrants | Ukraine | 30.1 /100 | #192 | Fair 97.4% |
| Immigrants | Egypt | 30.1 /100 | #193 | Fair 97.4% |
| Portuguese | 29.2 /100 | #194 | Fair 97.4% |
| Paraguayans | 28.9 /100 | #195 | Fair 97.4% |
| Immigrants | Albania | 27.7 /100 | #196 | Fair 97.4% |
| Hawaiians | 25.6 /100 | #197 | Fair 97.4% |
| Guamanians/Chamorros | 23.0 /100 | #198 | Fair 97.4% |
| Natives/Alaskans | 20.6 /100 | #199 | Fair 97.4% |
| Immigrants | Uganda | 19.8 /100 | #200 | Poor 97.4% |
| Immigrants | Southern Europe | 16.2 /100 | #201 | Poor 97.4% |
| Immigrants | Chile | 16.1 /100 | #202 | Poor 97.4% |
| Immigrants | Northern Africa | 15.1 /100 | #203 | Poor 97.4% |
| Africans | 14.6 /100 | #204 | Poor 97.4% |
Demographics Similar to Immigrants from Central America by 4th Grade
In terms of 4th grade, the demographic groups most similar to Immigrants from Central America are Immigrants from Guatemala (95.1%, a difference of 0.030%), Immigrants from Mexico (95.1%, a difference of 0.060%), Salvadoran (95.0%, a difference of 0.070%), Immigrants from Yemen (95.2%, a difference of 0.080%), and Yakama (95.2%, a difference of 0.090%).
| Demographics | Rating | Rank | 4th Grade |
| Immigrants | Dominican Republic | 0.0 /100 | #333 | Tragic 95.7% |
| Immigrants | Cabo Verde | 0.0 /100 | #334 | Tragic 95.7% |
| Immigrants | Latin America | 0.0 /100 | #335 | Tragic 95.7% |
| Mexicans | 0.0 /100 | #336 | Tragic 95.6% |
| Central Americans | 0.0 /100 | #337 | Tragic 95.5% |
| Nepalese | 0.0 /100 | #338 | Tragic 95.5% |
| Guatemalans | 0.0 /100 | #339 | Tragic 95.3% |
| Yakama | 0.0 /100 | #340 | Tragic 95.2% |
| Immigrants | Yemen | 0.0 /100 | #341 | Tragic 95.2% |
| Immigrants | Central America | 0.0 /100 | #342 | Tragic 95.1% |
| Immigrants | Guatemala | 0.0 /100 | #343 | Tragic 95.1% |
| Immigrants | Mexico | 0.0 /100 | #344 | Tragic 95.1% |
| Salvadorans | 0.0 /100 | #345 | Tragic 95.0% |
| Immigrants | El Salvador | 0.0 /100 | #346 | Tragic 94.8% |
| Spanish American Indians | 0.0 /100 | #347 | Tragic 94.6% |