Guatemalan vs Immigrants from Central America Male Disability
COMPARE
Guatemalan
Immigrants from Central America
Male Disability
Male Disability Comparison
Guatemalans
Immigrants from Central America
11.1%
MALE DISABILITY
67.2/ 100
METRIC RATING
159th/ 347
METRIC RANK
11.3%
MALE DISABILITY
32.9/ 100
METRIC RATING
183rd/ 347
METRIC RANK
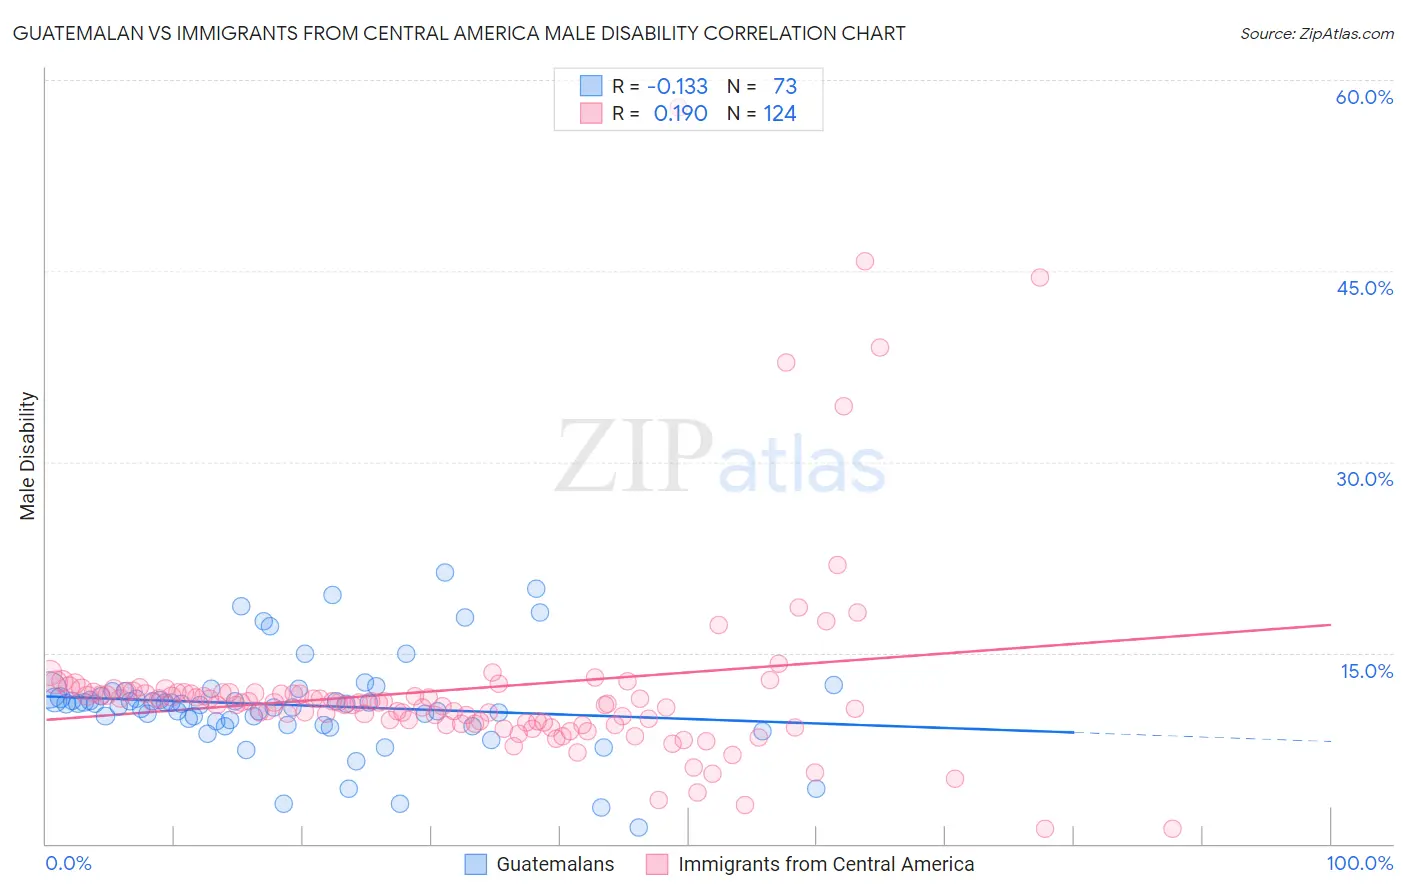
Guatemalan vs Immigrants from Central America Male Disability Correlation Chart
The statistical analysis conducted on geographies consisting of 409,466,260 people shows a poor negative correlation between the proportion of Guatemalans and percentage of males with a disability in the United States with a correlation coefficient (R) of -0.133 and weighted average of 11.1%. Similarly, the statistical analysis conducted on geographies consisting of 536,294,553 people shows a poor positive correlation between the proportion of Immigrants from Central America and percentage of males with a disability in the United States with a correlation coefficient (R) of 0.190 and weighted average of 11.3%, a difference of 2.0%.
Male Disability Correlation Summary
| Measurement | Guatemalan | Immigrants from Central America |
| Minimum | 1.3% | 1.2% |
| Maximum | 21.3% | 57.8% |
| Range | 20.1% | 56.6% |
| Mean | 10.9% | 12.1% |
| Median | 11.0% | 11.1% |
| Interquartile 25% (IQ1) | 9.5% | 9.5% |
| Interquartile 75% (IQ3) | 11.8% | 11.9% |
| Interquartile Range (IQR) | 2.3% | 2.4% |
| Standard Deviation (Sample) | 3.8% | 7.8% |
| Standard Deviation (Population) | 3.7% | 7.7% |
Similar Demographics by Male Disability
Demographics Similar to Guatemalans by Male Disability
In terms of male disability, the demographic groups most similar to Guatemalans are Albanian (11.1%, a difference of 0.040%), Latvian (11.1%, a difference of 0.060%), Immigrants from West Indies (11.1%, a difference of 0.090%), Immigrants from Haiti (11.1%, a difference of 0.12%), and Immigrants from Western Africa (11.1%, a difference of 0.13%).
| Demographics | Rating | Rank | Male Disability |
| Immigrants | Albania | 74.4 /100 | #152 | Good 11.0% |
| Immigrants | Northern Europe | 73.2 /100 | #153 | Good 11.1% |
| Immigrants | Moldova | 72.8 /100 | #154 | Good 11.1% |
| Immigrants | Middle Africa | 70.9 /100 | #155 | Good 11.1% |
| Russians | 69.8 /100 | #156 | Good 11.1% |
| Immigrants | Western Africa | 69.2 /100 | #157 | Good 11.1% |
| Latvians | 68.1 /100 | #158 | Good 11.1% |
| Guatemalans | 67.2 /100 | #159 | Good 11.1% |
| Albanians | 66.5 /100 | #160 | Good 11.1% |
| Immigrants | West Indies | 65.7 /100 | #161 | Good 11.1% |
| Immigrants | Haiti | 65.3 /100 | #162 | Good 11.1% |
| Immigrants | Kenya | 63.8 /100 | #163 | Good 11.1% |
| British West Indians | 62.8 /100 | #164 | Good 11.1% |
| Luxembourgers | 61.9 /100 | #165 | Good 11.1% |
| Immigrants | Hungary | 61.2 /100 | #166 | Good 11.1% |
Demographics Similar to Immigrants from Central America by Male Disability
In terms of male disability, the demographic groups most similar to Immigrants from Central America are Immigrants from Belize (11.3%, a difference of 0.050%), Immigrants from Senegal (11.3%, a difference of 0.090%), Iraqi (11.3%, a difference of 0.15%), Pakistani (11.3%, a difference of 0.16%), and Immigrants from Zaire (11.4%, a difference of 0.34%).
| Demographics | Rating | Rank | Male Disability |
| Syrians | 46.6 /100 | #176 | Average 11.2% |
| Immigrants | Norway | 44.2 /100 | #177 | Average 11.3% |
| Australians | 42.2 /100 | #178 | Average 11.3% |
| Immigrants | Caribbean | 41.4 /100 | #179 | Average 11.3% |
| Hondurans | 41.1 /100 | #180 | Average 11.3% |
| Immigrants | Senegal | 34.4 /100 | #181 | Fair 11.3% |
| Immigrants | Belize | 33.7 /100 | #182 | Fair 11.3% |
| Immigrants | Central America | 32.9 /100 | #183 | Fair 11.3% |
| Iraqis | 30.5 /100 | #184 | Fair 11.3% |
| Pakistanis | 30.3 /100 | #185 | Fair 11.3% |
| Immigrants | Zaire | 27.6 /100 | #186 | Fair 11.4% |
| Immigrants | Austria | 27.3 /100 | #187 | Fair 11.4% |
| Estonians | 26.8 /100 | #188 | Fair 11.4% |
| Immigrants | Netherlands | 25.9 /100 | #189 | Fair 11.4% |
| Immigrants | Bosnia and Herzegovina | 25.4 /100 | #190 | Fair 11.4% |