Guyanese vs Immigrants from Laos Cognitive Disability
COMPARE
Guyanese
Immigrants from Laos
Cognitive Disability
Cognitive Disability Comparison
Guyanese
Immigrants from Laos
17.5%
COGNITIVE DISABILITY
17.5/ 100
METRIC RATING
196th/ 347
METRIC RANK
18.1%
COGNITIVE DISABILITY
0.2/ 100
METRIC RATING
275th/ 347
METRIC RANK
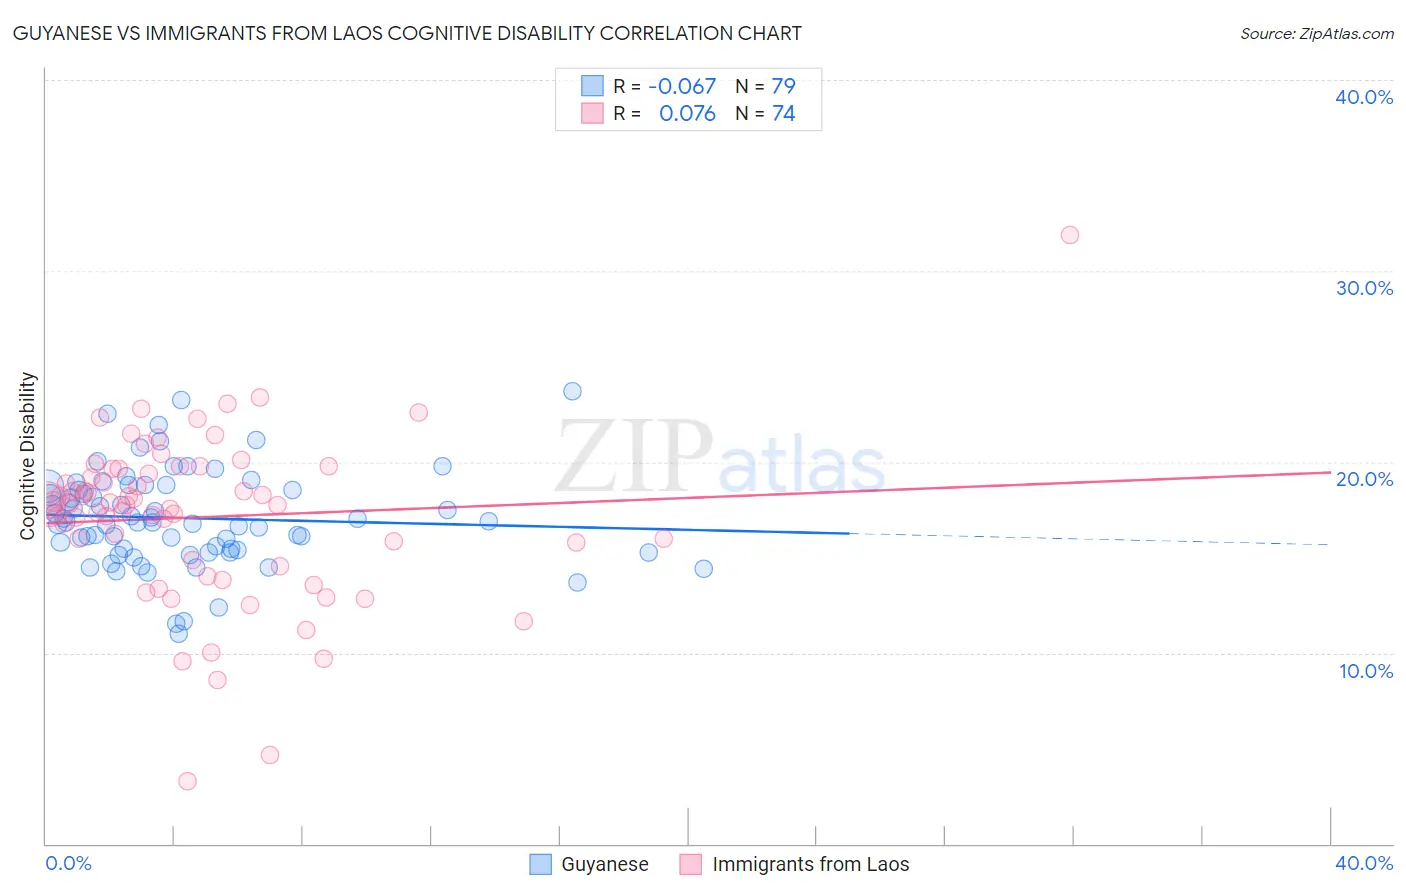
Guyanese vs Immigrants from Laos Cognitive Disability Correlation Chart
The statistical analysis conducted on geographies consisting of 176,911,686 people shows a slight negative correlation between the proportion of Guyanese and percentage of population with cognitive disability in the United States with a correlation coefficient (R) of -0.067 and weighted average of 17.5%. Similarly, the statistical analysis conducted on geographies consisting of 201,469,201 people shows a slight positive correlation between the proportion of Immigrants from Laos and percentage of population with cognitive disability in the United States with a correlation coefficient (R) of 0.076 and weighted average of 18.1%, a difference of 3.4%.
Cognitive Disability Correlation Summary
| Measurement | Guyanese | Immigrants from Laos |
| Minimum | 11.0% | 3.3% |
| Maximum | 23.7% | 31.9% |
| Range | 12.7% | 28.6% |
| Mean | 17.1% | 17.1% |
| Median | 16.9% | 17.8% |
| Interquartile 25% (IQ1) | 15.4% | 14.9% |
| Interquartile 75% (IQ3) | 18.7% | 19.6% |
| Interquartile Range (IQR) | 3.3% | 4.7% |
| Standard Deviation (Sample) | 2.5% | 4.3% |
| Standard Deviation (Population) | 2.5% | 4.3% |
Similar Demographics by Cognitive Disability
Demographics Similar to Guyanese by Cognitive Disability
In terms of cognitive disability, the demographic groups most similar to Guyanese are Immigrants from Afghanistan (17.5%, a difference of 0.040%), Immigrants from Panama (17.5%, a difference of 0.14%), New Zealander (17.4%, a difference of 0.16%), Immigrants from Singapore (17.5%, a difference of 0.17%), and Haitian (17.5%, a difference of 0.18%).
| Demographics | Rating | Rank | Cognitive Disability |
| Immigrants | Western Asia | 29.5 /100 | #189 | Fair 17.4% |
| Immigrants | Spain | 27.7 /100 | #190 | Fair 17.4% |
| Immigrants | Nonimmigrants | 27.4 /100 | #191 | Fair 17.4% |
| Immigrants | Haiti | 27.1 /100 | #192 | Fair 17.4% |
| Delaware | 25.6 /100 | #193 | Fair 17.4% |
| Immigrants | Bosnia and Herzegovina | 22.0 /100 | #194 | Fair 17.4% |
| New Zealanders | 21.1 /100 | #195 | Fair 17.4% |
| Guyanese | 17.5 /100 | #196 | Poor 17.5% |
| Immigrants | Afghanistan | 16.7 /100 | #197 | Poor 17.5% |
| Immigrants | Panama | 14.8 /100 | #198 | Poor 17.5% |
| Immigrants | Singapore | 14.3 /100 | #199 | Poor 17.5% |
| Haitians | 14.1 /100 | #200 | Poor 17.5% |
| South American Indians | 13.0 /100 | #201 | Poor 17.5% |
| Immigrants | Morocco | 12.0 /100 | #202 | Poor 17.5% |
| Immigrants | Caribbean | 11.0 /100 | #203 | Poor 17.5% |
Demographics Similar to Immigrants from Laos by Cognitive Disability
In terms of cognitive disability, the demographic groups most similar to Immigrants from Laos are Yuman (18.1%, a difference of 0.040%), Immigrants from Kuwait (18.1%, a difference of 0.050%), Immigrants from Micronesia (18.1%, a difference of 0.050%), Immigrants from Nigeria (18.0%, a difference of 0.10%), and Chippewa (18.1%, a difference of 0.10%).
| Demographics | Rating | Rank | Cognitive Disability |
| Cherokee | 0.3 /100 | #268 | Tragic 18.0% |
| Hondurans | 0.3 /100 | #269 | Tragic 18.0% |
| Immigrants | Bahamas | 0.3 /100 | #270 | Tragic 18.0% |
| Potawatomi | 0.2 /100 | #271 | Tragic 18.0% |
| Immigrants | Honduras | 0.2 /100 | #272 | Tragic 18.0% |
| Immigrants | Nepal | 0.2 /100 | #273 | Tragic 18.0% |
| Immigrants | Nigeria | 0.2 /100 | #274 | Tragic 18.0% |
| Immigrants | Laos | 0.2 /100 | #275 | Tragic 18.1% |
| Yuman | 0.2 /100 | #276 | Tragic 18.1% |
| Immigrants | Kuwait | 0.2 /100 | #277 | Tragic 18.1% |
| Immigrants | Micronesia | 0.2 /100 | #278 | Tragic 18.1% |
| Chippewa | 0.1 /100 | #279 | Tragic 18.1% |
| West Indians | 0.1 /100 | #280 | Tragic 18.1% |
| Yakama | 0.1 /100 | #281 | Tragic 18.1% |
| Immigrants | Cambodia | 0.1 /100 | #282 | Tragic 18.1% |