Guyanese vs Canadian Cognitive Disability
COMPARE
Guyanese
Canadian
Cognitive Disability
Cognitive Disability Comparison
Guyanese
Canadians
17.5%
COGNITIVE DISABILITY
17.5/ 100
METRIC RATING
196th/ 347
METRIC RANK
16.8%
COGNITIVE DISABILITY
97.5/ 100
METRIC RATING
108th/ 347
METRIC RANK
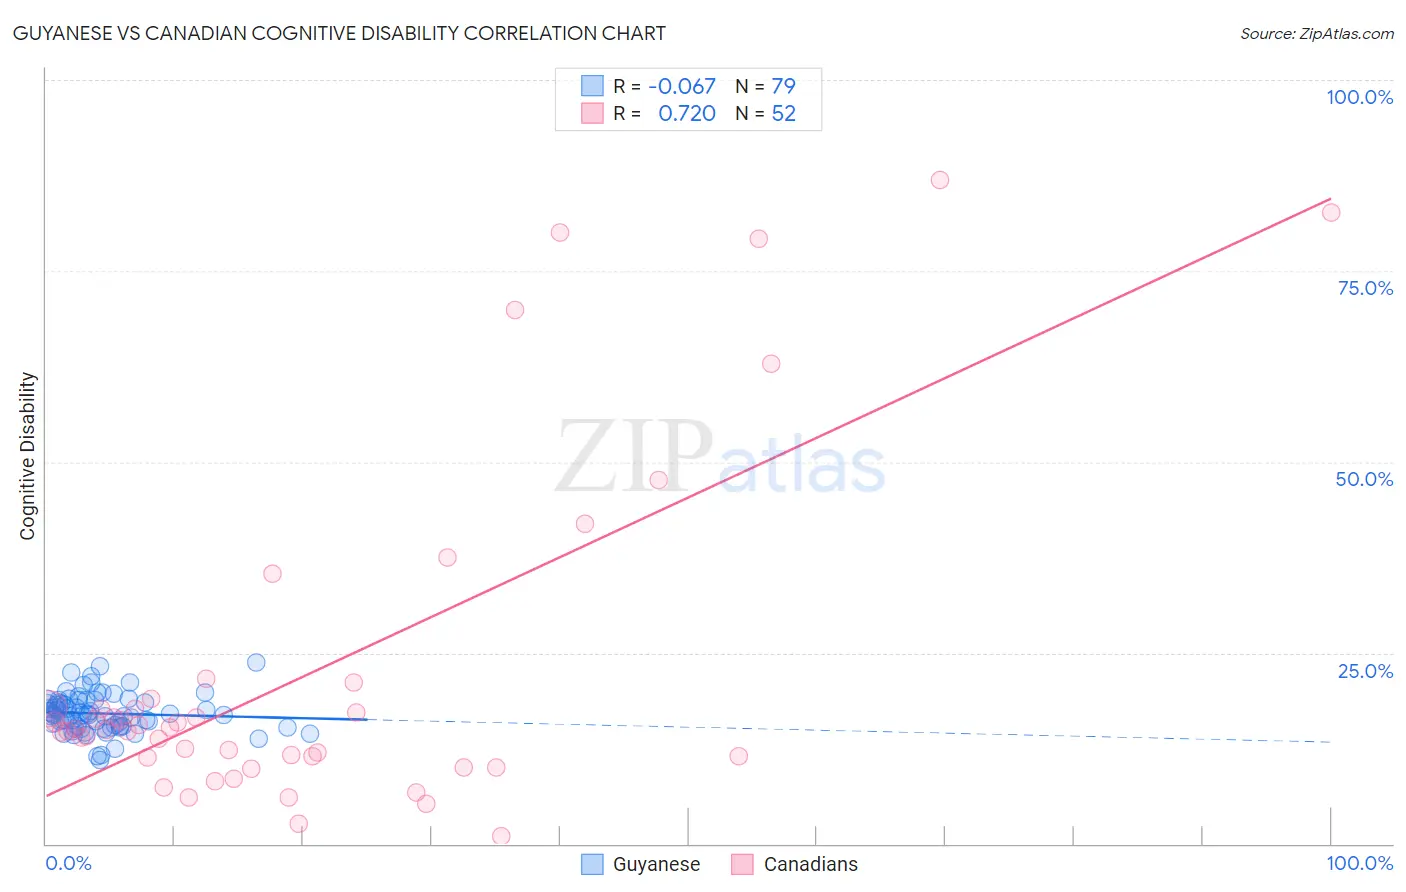
Guyanese vs Canadian Cognitive Disability Correlation Chart
The statistical analysis conducted on geographies consisting of 176,911,686 people shows a slight negative correlation between the proportion of Guyanese and percentage of population with cognitive disability in the United States with a correlation coefficient (R) of -0.067 and weighted average of 17.5%. Similarly, the statistical analysis conducted on geographies consisting of 437,506,516 people shows a strong positive correlation between the proportion of Canadians and percentage of population with cognitive disability in the United States with a correlation coefficient (R) of 0.720 and weighted average of 16.8%, a difference of 3.8%.
Cognitive Disability Correlation Summary
| Measurement | Guyanese | Canadian |
| Minimum | 11.0% | 1.0% |
| Maximum | 23.7% | 87.0% |
| Range | 12.7% | 85.9% |
| Mean | 17.1% | 22.4% |
| Median | 16.9% | 15.0% |
| Interquartile 25% (IQ1) | 15.4% | 11.3% |
| Interquartile 75% (IQ3) | 18.7% | 18.4% |
| Interquartile Range (IQR) | 3.3% | 7.1% |
| Standard Deviation (Sample) | 2.5% | 21.9% |
| Standard Deviation (Population) | 2.5% | 21.7% |
Similar Demographics by Cognitive Disability
Demographics Similar to Guyanese by Cognitive Disability
In terms of cognitive disability, the demographic groups most similar to Guyanese are Immigrants from Afghanistan (17.5%, a difference of 0.040%), Immigrants from Panama (17.5%, a difference of 0.14%), New Zealander (17.4%, a difference of 0.16%), Immigrants from Singapore (17.5%, a difference of 0.17%), and Haitian (17.5%, a difference of 0.18%).
| Demographics | Rating | Rank | Cognitive Disability |
| Immigrants | Western Asia | 29.5 /100 | #189 | Fair 17.4% |
| Immigrants | Spain | 27.7 /100 | #190 | Fair 17.4% |
| Immigrants | Nonimmigrants | 27.4 /100 | #191 | Fair 17.4% |
| Immigrants | Haiti | 27.1 /100 | #192 | Fair 17.4% |
| Delaware | 25.6 /100 | #193 | Fair 17.4% |
| Immigrants | Bosnia and Herzegovina | 22.0 /100 | #194 | Fair 17.4% |
| New Zealanders | 21.1 /100 | #195 | Fair 17.4% |
| Guyanese | 17.5 /100 | #196 | Poor 17.5% |
| Immigrants | Afghanistan | 16.7 /100 | #197 | Poor 17.5% |
| Immigrants | Panama | 14.8 /100 | #198 | Poor 17.5% |
| Immigrants | Singapore | 14.3 /100 | #199 | Poor 17.5% |
| Haitians | 14.1 /100 | #200 | Poor 17.5% |
| South American Indians | 13.0 /100 | #201 | Poor 17.5% |
| Immigrants | Morocco | 12.0 /100 | #202 | Poor 17.5% |
| Immigrants | Caribbean | 11.0 /100 | #203 | Poor 17.5% |
Demographics Similar to Canadians by Cognitive Disability
In terms of cognitive disability, the demographic groups most similar to Canadians are Albanian (16.8%, a difference of 0.050%), Arapaho (16.8%, a difference of 0.060%), Uruguayan (16.8%, a difference of 0.070%), Immigrants from Nicaragua (16.8%, a difference of 0.090%), and Indian (Asian) (16.8%, a difference of 0.090%).
| Demographics | Rating | Rank | Cognitive Disability |
| Immigrants | Asia | 98.1 /100 | #101 | Exceptional 16.8% |
| Irish | 98.1 /100 | #102 | Exceptional 16.8% |
| Paraguayans | 98.0 /100 | #103 | Exceptional 16.8% |
| Palestinians | 98.0 /100 | #104 | Exceptional 16.8% |
| Immigrants | Eastern Asia | 97.9 /100 | #105 | Exceptional 16.8% |
| Northern Europeans | 97.8 /100 | #106 | Exceptional 16.8% |
| Immigrants | Nicaragua | 97.8 /100 | #107 | Exceptional 16.8% |
| Canadians | 97.5 /100 | #108 | Exceptional 16.8% |
| Albanians | 97.3 /100 | #109 | Exceptional 16.8% |
| Arapaho | 97.3 /100 | #110 | Exceptional 16.8% |
| Uruguayans | 97.2 /100 | #111 | Exceptional 16.8% |
| Indians (Asian) | 97.2 /100 | #112 | Exceptional 16.8% |
| Immigrants | Sri Lanka | 97.1 /100 | #113 | Exceptional 16.8% |
| Koreans | 97.1 /100 | #114 | Exceptional 16.8% |
| Yup'ik | 96.9 /100 | #115 | Exceptional 16.9% |