Guatemalan vs Immigrants from Vietnam Hearing Disability
COMPARE
Guatemalan
Immigrants from Vietnam
Hearing Disability
Hearing Disability Comparison
Guatemalans
Immigrants from Vietnam
2.8%
HEARING DISABILITY
93.2/ 100
METRIC RATING
108th/ 347
METRIC RANK
2.9%
HEARING DISABILITY
86.5/ 100
METRIC RATING
130th/ 347
METRIC RANK
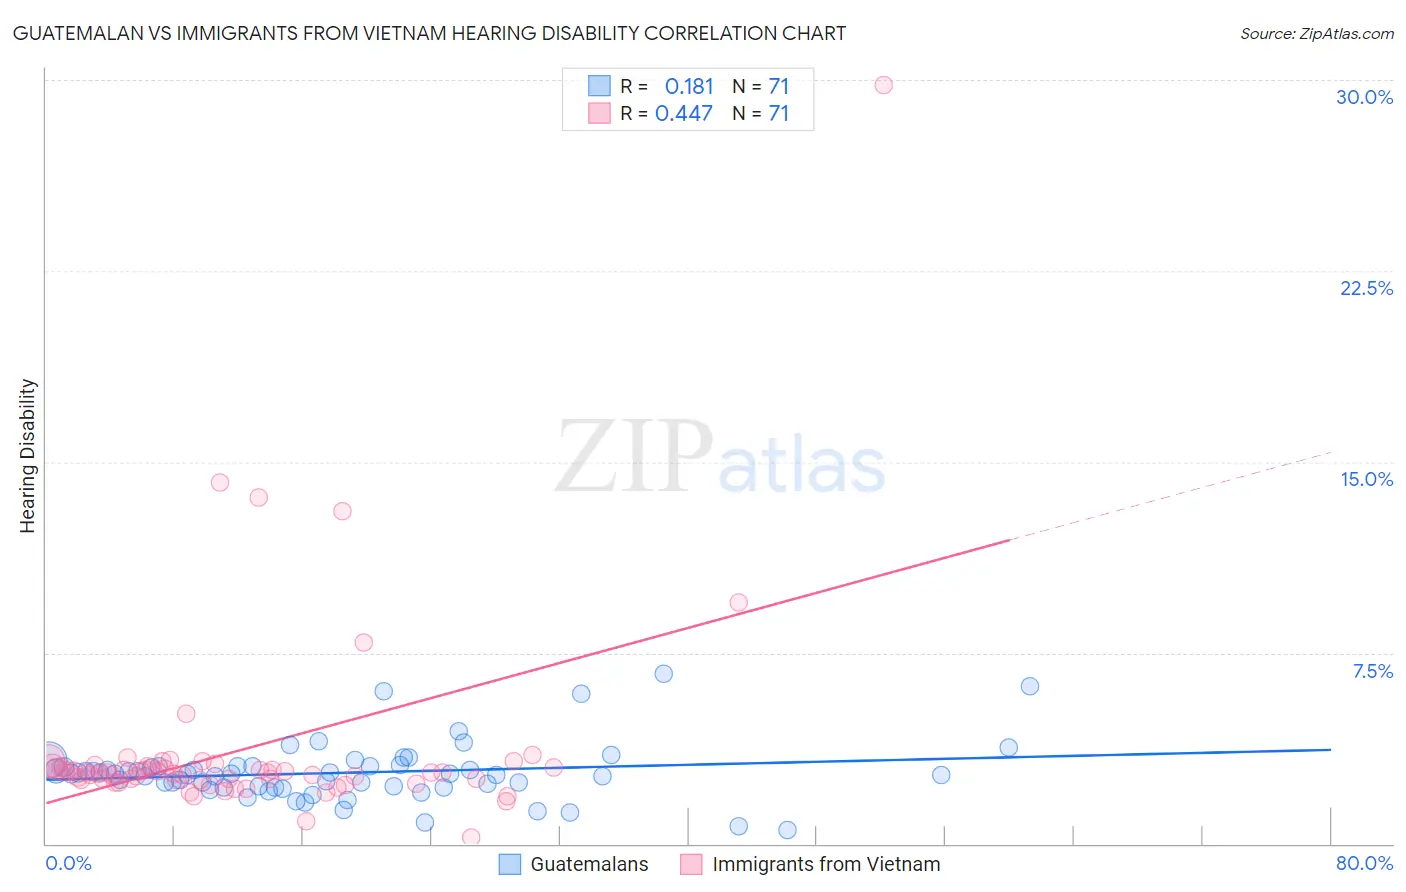
Guatemalan vs Immigrants from Vietnam Hearing Disability Correlation Chart
The statistical analysis conducted on geographies consisting of 409,374,057 people shows a poor positive correlation between the proportion of Guatemalans and percentage of population with hearing disability in the United States with a correlation coefficient (R) of 0.181 and weighted average of 2.8%. Similarly, the statistical analysis conducted on geographies consisting of 404,662,958 people shows a moderate positive correlation between the proportion of Immigrants from Vietnam and percentage of population with hearing disability in the United States with a correlation coefficient (R) of 0.447 and weighted average of 2.9%, a difference of 1.9%.
Hearing Disability Correlation Summary
| Measurement | Guatemalan | Immigrants from Vietnam |
| Minimum | 0.55% | 0.23% |
| Maximum | 6.7% | 29.8% |
| Range | 6.1% | 29.6% |
| Mean | 2.8% | 3.7% |
| Median | 2.7% | 2.8% |
| Interquartile 25% (IQ1) | 2.2% | 2.5% |
| Interquartile 75% (IQ3) | 3.0% | 3.0% |
| Interquartile Range (IQR) | 0.81% | 0.53% |
| Standard Deviation (Sample) | 1.1% | 4.0% |
| Standard Deviation (Population) | 1.1% | 4.0% |
Similar Demographics by Hearing Disability
Demographics Similar to Guatemalans by Hearing Disability
In terms of hearing disability, the demographic groups most similar to Guatemalans are Turkish (2.8%, a difference of 0.070%), Honduran (2.8%, a difference of 0.080%), Immigrants from Chile (2.8%, a difference of 0.080%), Cypriot (2.8%, a difference of 0.12%), and Immigrants from Yemen (2.8%, a difference of 0.17%).
| Demographics | Rating | Rank | Hearing Disability |
| Immigrants | Spain | 94.9 /100 | #101 | Exceptional 2.8% |
| Taiwanese | 94.8 /100 | #102 | Exceptional 2.8% |
| Immigrants | Indonesia | 94.7 /100 | #103 | Exceptional 2.8% |
| Burmese | 94.2 /100 | #104 | Exceptional 2.8% |
| Moroccans | 93.9 /100 | #105 | Exceptional 2.8% |
| Hondurans | 93.4 /100 | #106 | Exceptional 2.8% |
| Immigrants | Chile | 93.4 /100 | #107 | Exceptional 2.8% |
| Guatemalans | 93.2 /100 | #108 | Exceptional 2.8% |
| Turks | 93.0 /100 | #109 | Exceptional 2.8% |
| Cypriots | 92.9 /100 | #110 | Exceptional 2.8% |
| Immigrants | Yemen | 92.7 /100 | #111 | Exceptional 2.8% |
| U.S. Virgin Islanders | 92.5 /100 | #112 | Exceptional 2.8% |
| Immigrants | Belarus | 91.6 /100 | #113 | Exceptional 2.8% |
| Cambodians | 91.1 /100 | #114 | Exceptional 2.8% |
| Immigrants | Latin America | 90.5 /100 | #115 | Exceptional 2.8% |
Demographics Similar to Immigrants from Vietnam by Hearing Disability
In terms of hearing disability, the demographic groups most similar to Immigrants from Vietnam are Immigrants from Uganda (2.9%, a difference of 0.020%), South American Indian (2.9%, a difference of 0.070%), Immigrants from Western Asia (2.9%, a difference of 0.070%), Immigrants from Kenya (2.9%, a difference of 0.090%), and Chilean (2.9%, a difference of 0.14%).
| Demographics | Rating | Rank | Hearing Disability |
| Immigrants | Zaire | 88.6 /100 | #123 | Excellent 2.9% |
| Bahamians | 88.6 /100 | #124 | Excellent 2.9% |
| Immigrants | Albania | 88.5 /100 | #125 | Excellent 2.9% |
| Immigrants | Sudan | 87.8 /100 | #126 | Excellent 2.9% |
| South American Indians | 86.9 /100 | #127 | Excellent 2.9% |
| Immigrants | Western Asia | 86.9 /100 | #128 | Excellent 2.9% |
| Immigrants | Uganda | 86.6 /100 | #129 | Excellent 2.9% |
| Immigrants | Vietnam | 86.5 /100 | #130 | Excellent 2.9% |
| Immigrants | Kenya | 86.1 /100 | #131 | Excellent 2.9% |
| Chileans | 85.8 /100 | #132 | Excellent 2.9% |
| Immigrants | Syria | 85.8 /100 | #133 | Excellent 2.9% |
| Ugandans | 85.5 /100 | #134 | Excellent 2.9% |
| Soviet Union | 84.8 /100 | #135 | Excellent 2.9% |
| Immigrants | Brazil | 84.6 /100 | #136 | Excellent 2.9% |
| Sri Lankans | 84.1 /100 | #137 | Excellent 2.9% |