Paraguayan vs Scottish Disability Age 65 to 74
COMPARE
Paraguayan
Scottish
Disability Age 65 to 74
Disability Age 65 to 74 Comparison
Paraguayans
Scottish
20.5%
DISABILITY AGE 65 TO 74
100.0/ 100
METRIC RATING
15th/ 347
METRIC RANK
23.6%
DISABILITY AGE 65 TO 74
33.1/ 100
METRIC RATING
189th/ 347
METRIC RANK
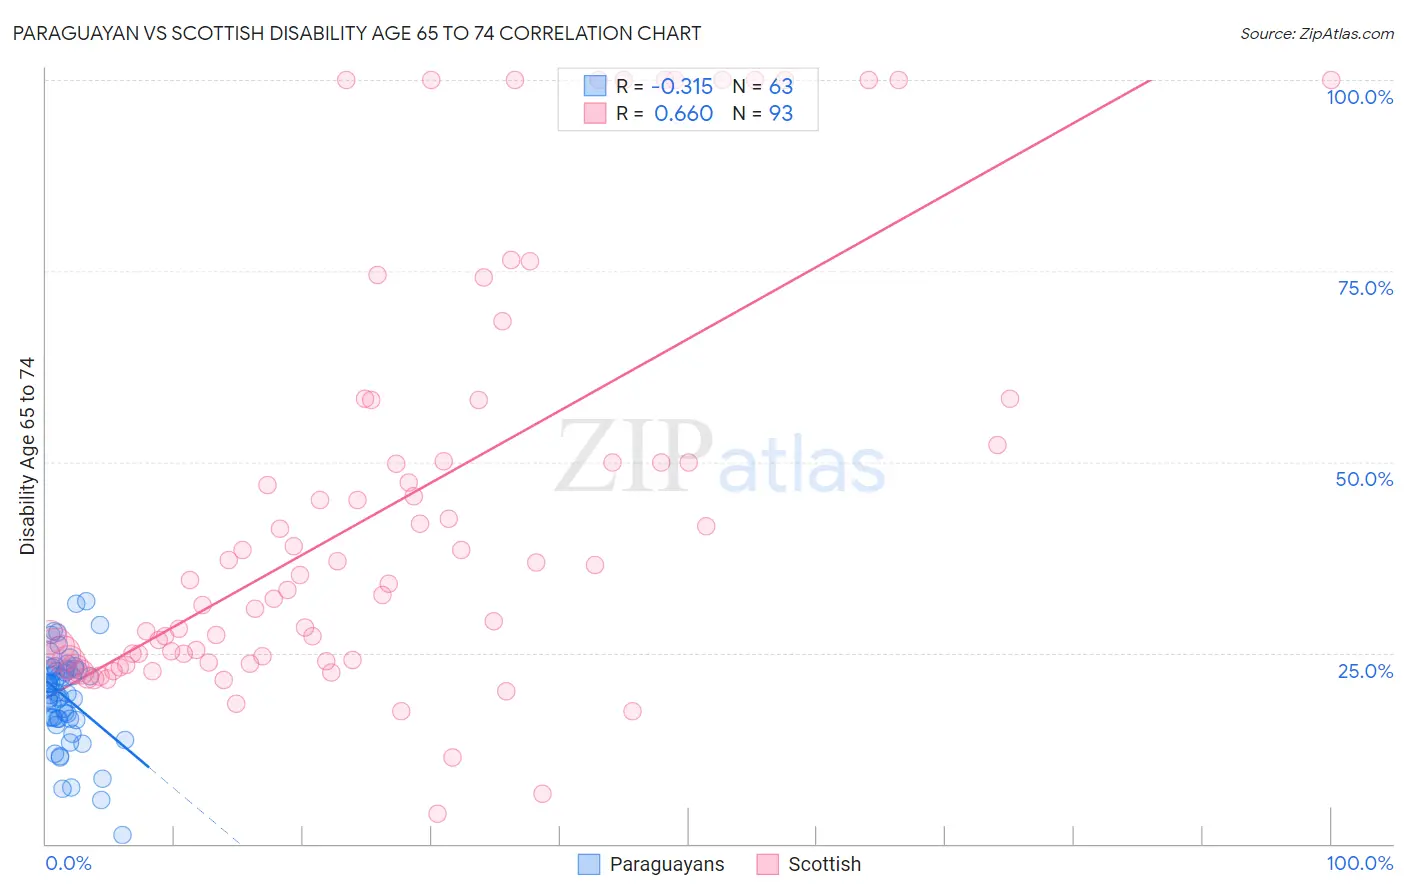
Paraguayan vs Scottish Disability Age 65 to 74 Correlation Chart
The statistical analysis conducted on geographies consisting of 95,081,049 people shows a mild negative correlation between the proportion of Paraguayans and percentage of population with a disability between the ages 65 and 75 in the United States with a correlation coefficient (R) of -0.315 and weighted average of 20.5%. Similarly, the statistical analysis conducted on geographies consisting of 564,724,008 people shows a significant positive correlation between the proportion of Scottish and percentage of population with a disability between the ages 65 and 75 in the United States with a correlation coefficient (R) of 0.660 and weighted average of 23.6%, a difference of 14.8%.
Disability Age 65 to 74 Correlation Summary
| Measurement | Paraguayan | Scottish |
| Minimum | 1.2% | 4.0% |
| Maximum | 31.8% | 100.0% |
| Range | 30.6% | 96.0% |
| Mean | 19.2% | 43.7% |
| Median | 19.8% | 34.0% |
| Interquartile 25% (IQ1) | 16.3% | 24.0% |
| Interquartile 75% (IQ3) | 22.9% | 51.1% |
| Interquartile Range (IQR) | 6.5% | 27.1% |
| Standard Deviation (Sample) | 6.0% | 27.1% |
| Standard Deviation (Population) | 5.9% | 26.9% |
Similar Demographics by Disability Age 65 to 74
Demographics Similar to Paraguayans by Disability Age 65 to 74
In terms of disability age 65 to 74, the demographic groups most similar to Paraguayans are Indian (Asian) (20.5%, a difference of 0.020%), Immigrants from Lithuania (20.5%, a difference of 0.060%), Immigrants from South Central Asia (20.6%, a difference of 0.31%), Eastern European (20.6%, a difference of 0.38%), and Burmese (20.6%, a difference of 0.41%).
| Demographics | Rating | Rank | Disability Age 65 to 74 |
| Thais | 100.0 /100 | #8 | Exceptional 20.1% |
| Immigrants | China | 100.0 /100 | #9 | Exceptional 20.3% |
| Immigrants | Eastern Asia | 100.0 /100 | #10 | Exceptional 20.3% |
| Immigrants | Ireland | 100.0 /100 | #11 | Exceptional 20.3% |
| Immigrants | Korea | 100.0 /100 | #12 | Exceptional 20.4% |
| Immigrants | Singapore | 100.0 /100 | #13 | Exceptional 20.4% |
| Indians (Asian) | 100.0 /100 | #14 | Exceptional 20.5% |
| Paraguayans | 100.0 /100 | #15 | Exceptional 20.5% |
| Immigrants | Lithuania | 100.0 /100 | #16 | Exceptional 20.5% |
| Immigrants | South Central Asia | 100.0 /100 | #17 | Exceptional 20.6% |
| Eastern Europeans | 100.0 /100 | #18 | Exceptional 20.6% |
| Burmese | 100.0 /100 | #19 | Exceptional 20.6% |
| Okinawans | 100.0 /100 | #20 | Exceptional 20.7% |
| Immigrants | Bolivia | 99.9 /100 | #21 | Exceptional 20.8% |
| Immigrants | Iran | 99.9 /100 | #22 | Exceptional 20.9% |
Demographics Similar to Scottish by Disability Age 65 to 74
In terms of disability age 65 to 74, the demographic groups most similar to Scottish are Immigrants from Cuba (23.6%, a difference of 0.060%), Immigrants from Guyana (23.6%, a difference of 0.12%), Immigrants from Bangladesh (23.6%, a difference of 0.19%), Ecuadorian (23.6%, a difference of 0.23%), and Portuguese (23.5%, a difference of 0.30%).
| Demographics | Rating | Rank | Disability Age 65 to 74 |
| Irish | 44.4 /100 | #182 | Average 23.4% |
| Immigrants | Eastern Africa | 42.8 /100 | #183 | Average 23.4% |
| Immigrants | Germany | 42.5 /100 | #184 | Average 23.4% |
| Haitians | 42.4 /100 | #185 | Average 23.4% |
| Basques | 38.4 /100 | #186 | Fair 23.5% |
| Portuguese | 37.8 /100 | #187 | Fair 23.5% |
| Immigrants | Cuba | 34.0 /100 | #188 | Fair 23.6% |
| Scottish | 33.1 /100 | #189 | Fair 23.6% |
| Immigrants | Guyana | 31.2 /100 | #190 | Fair 23.6% |
| Immigrants | Bangladesh | 30.2 /100 | #191 | Fair 23.6% |
| Ecuadorians | 29.7 /100 | #192 | Fair 23.6% |
| English | 28.5 /100 | #193 | Fair 23.6% |
| Sudanese | 27.8 /100 | #194 | Fair 23.7% |
| Immigrants | St. Vincent and the Grenadines | 26.1 /100 | #195 | Fair 23.7% |
| Immigrants | Trinidad and Tobago | 26.1 /100 | #196 | Fair 23.7% |