Immigrants from Syria vs Jamaican Disability Age 18 to 34
COMPARE
Immigrants from Syria
Jamaican
Disability Age 18 to 34
Disability Age 18 to 34 Comparison
Immigrants from Syria
Jamaicans
6.2%
DISABILITY AGE 18 TO 34
97.2/ 100
METRIC RATING
98th/ 347
METRIC RANK
6.4%
DISABILITY AGE 18 TO 34
86.8/ 100
METRIC RATING
141st/ 347
METRIC RANK
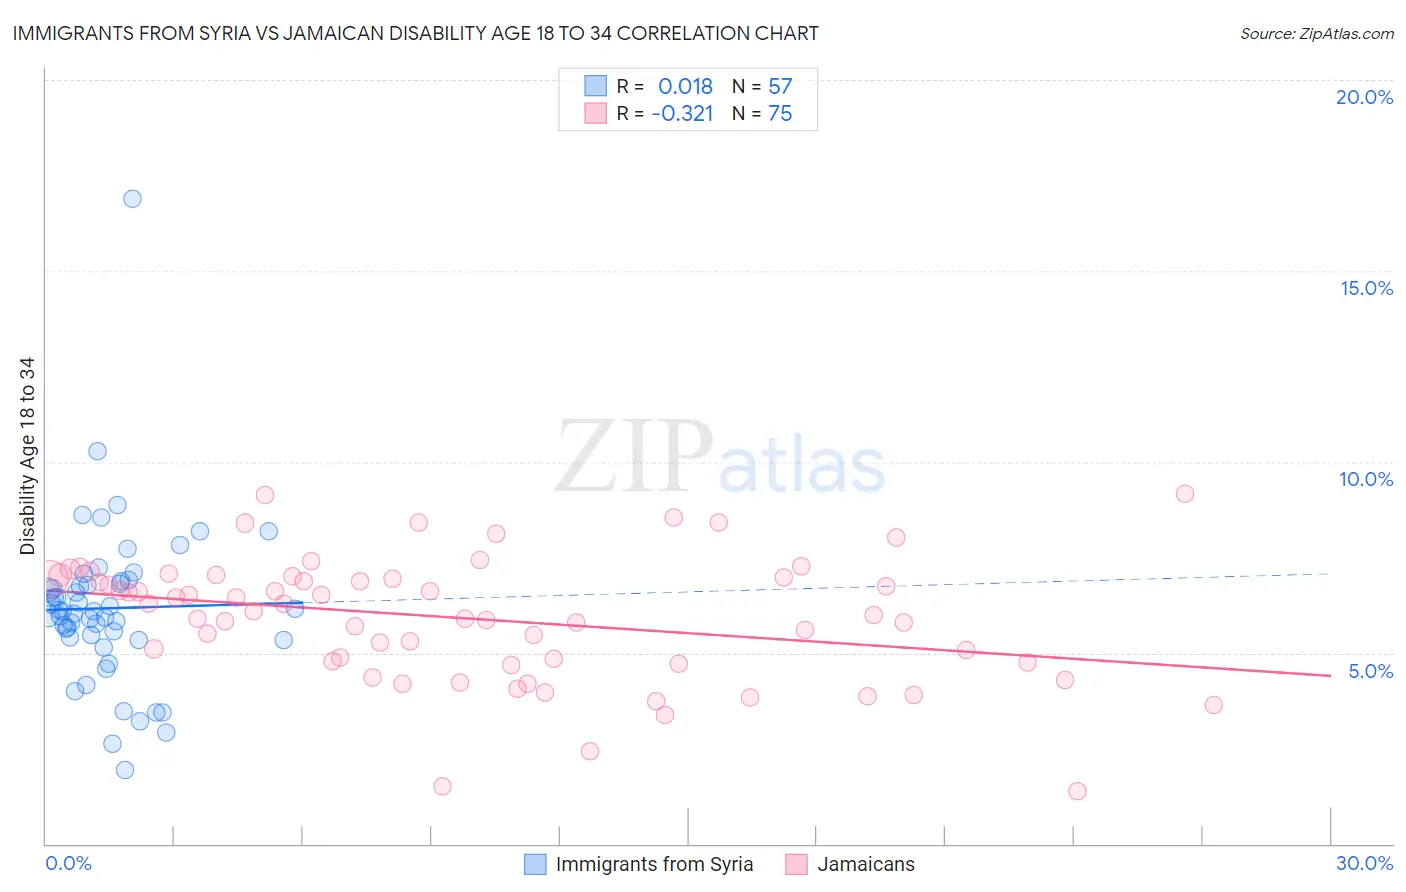
Immigrants from Syria vs Jamaican Disability Age 18 to 34 Correlation Chart
The statistical analysis conducted on geographies consisting of 174,067,522 people shows no correlation between the proportion of Immigrants from Syria and percentage of population with a disability between the ages 18 and 35 in the United States with a correlation coefficient (R) of 0.018 and weighted average of 6.2%. Similarly, the statistical analysis conducted on geographies consisting of 367,393,519 people shows a mild negative correlation between the proportion of Jamaicans and percentage of population with a disability between the ages 18 and 35 in the United States with a correlation coefficient (R) of -0.321 and weighted average of 6.4%, a difference of 3.1%.
Disability Age 18 to 34 Correlation Summary
| Measurement | Immigrants from Syria | Jamaican |
| Minimum | 1.9% | 1.4% |
| Maximum | 16.9% | 9.2% |
| Range | 14.9% | 7.8% |
| Mean | 6.2% | 5.9% |
| Median | 6.1% | 6.1% |
| Interquartile 25% (IQ1) | 5.4% | 4.7% |
| Interquartile 75% (IQ3) | 6.9% | 7.0% |
| Interquartile Range (IQR) | 1.5% | 2.2% |
| Standard Deviation (Sample) | 2.2% | 1.6% |
| Standard Deviation (Population) | 2.1% | 1.6% |
Similar Demographics by Disability Age 18 to 34
Demographics Similar to Immigrants from Syria by Disability Age 18 to 34
In terms of disability age 18 to 34, the demographic groups most similar to Immigrants from Syria are Uruguayan (6.2%, a difference of 0.040%), Immigrants from Uruguay (6.2%, a difference of 0.13%), Central American (6.2%, a difference of 0.17%), Immigrants from Kazakhstan (6.2%, a difference of 0.20%), and Immigrants from Ethiopia (6.2%, a difference of 0.21%).
| Demographics | Rating | Rank | Disability Age 18 to 34 |
| Immigrants | Philippines | 97.6 /100 | #91 | Exceptional 6.2% |
| Jordanians | 97.6 /100 | #92 | Exceptional 6.2% |
| Immigrants | Immigrants | 97.6 /100 | #93 | Exceptional 6.2% |
| Immigrants | Kazakhstan | 97.5 /100 | #94 | Exceptional 6.2% |
| Central Americans | 97.5 /100 | #95 | Exceptional 6.2% |
| Immigrants | Uruguay | 97.4 /100 | #96 | Exceptional 6.2% |
| Uruguayans | 97.3 /100 | #97 | Exceptional 6.2% |
| Immigrants | Syria | 97.2 /100 | #98 | Exceptional 6.2% |
| Immigrants | Ethiopia | 96.9 /100 | #99 | Exceptional 6.2% |
| Immigrants | Albania | 96.7 /100 | #100 | Exceptional 6.2% |
| Immigrants | Jamaica | 96.4 /100 | #101 | Exceptional 6.2% |
| Laotians | 96.4 /100 | #102 | Exceptional 6.2% |
| Immigrants | Bulgaria | 96.3 /100 | #103 | Exceptional 6.2% |
| Mongolians | 96.2 /100 | #104 | Exceptional 6.2% |
| Bhutanese | 96.2 /100 | #105 | Exceptional 6.2% |
Demographics Similar to Jamaicans by Disability Age 18 to 34
In terms of disability age 18 to 34, the demographic groups most similar to Jamaicans are South American Indian (6.4%, a difference of 0.030%), Immigrants from Latvia (6.4%, a difference of 0.050%), Immigrants from Fiji (6.4%, a difference of 0.090%), Immigrants from Belize (6.4%, a difference of 0.11%), and Immigrants from Honduras (6.4%, a difference of 0.16%).
| Demographics | Rating | Rank | Disability Age 18 to 34 |
| Immigrants | Europe | 88.8 /100 | #134 | Excellent 6.4% |
| Palestinians | 88.5 /100 | #135 | Excellent 6.4% |
| Immigrants | Sweden | 88.5 /100 | #136 | Excellent 6.4% |
| Immigrants | Honduras | 87.7 /100 | #137 | Excellent 6.4% |
| Spanish American Indians | 87.7 /100 | #138 | Excellent 6.4% |
| Immigrants | Belize | 87.4 /100 | #139 | Excellent 6.4% |
| Immigrants | Fiji | 87.3 /100 | #140 | Excellent 6.4% |
| Jamaicans | 86.8 /100 | #141 | Excellent 6.4% |
| South American Indians | 86.5 /100 | #142 | Excellent 6.4% |
| Immigrants | Latvia | 86.4 /100 | #143 | Excellent 6.4% |
| Albanians | 85.3 /100 | #144 | Excellent 6.4% |
| Moroccans | 85.2 /100 | #145 | Excellent 6.4% |
| Belizeans | 84.9 /100 | #146 | Excellent 6.4% |
| Immigrants | South Africa | 83.7 /100 | #147 | Excellent 6.4% |
| Immigrants | Belgium | 83.5 /100 | #148 | Excellent 6.4% |