Immigrants from South Central Asia vs Cape Verdean Hearing Disability
COMPARE
Immigrants from South Central Asia
Cape Verdean
Hearing Disability
Hearing Disability Comparison
Immigrants from South Central Asia
Cape Verdeans
2.6%
HEARING DISABILITY
99.7/ 100
METRIC RATING
27th/ 347
METRIC RANK
3.1%
HEARING DISABILITY
12.2/ 100
METRIC RATING
210th/ 347
METRIC RANK
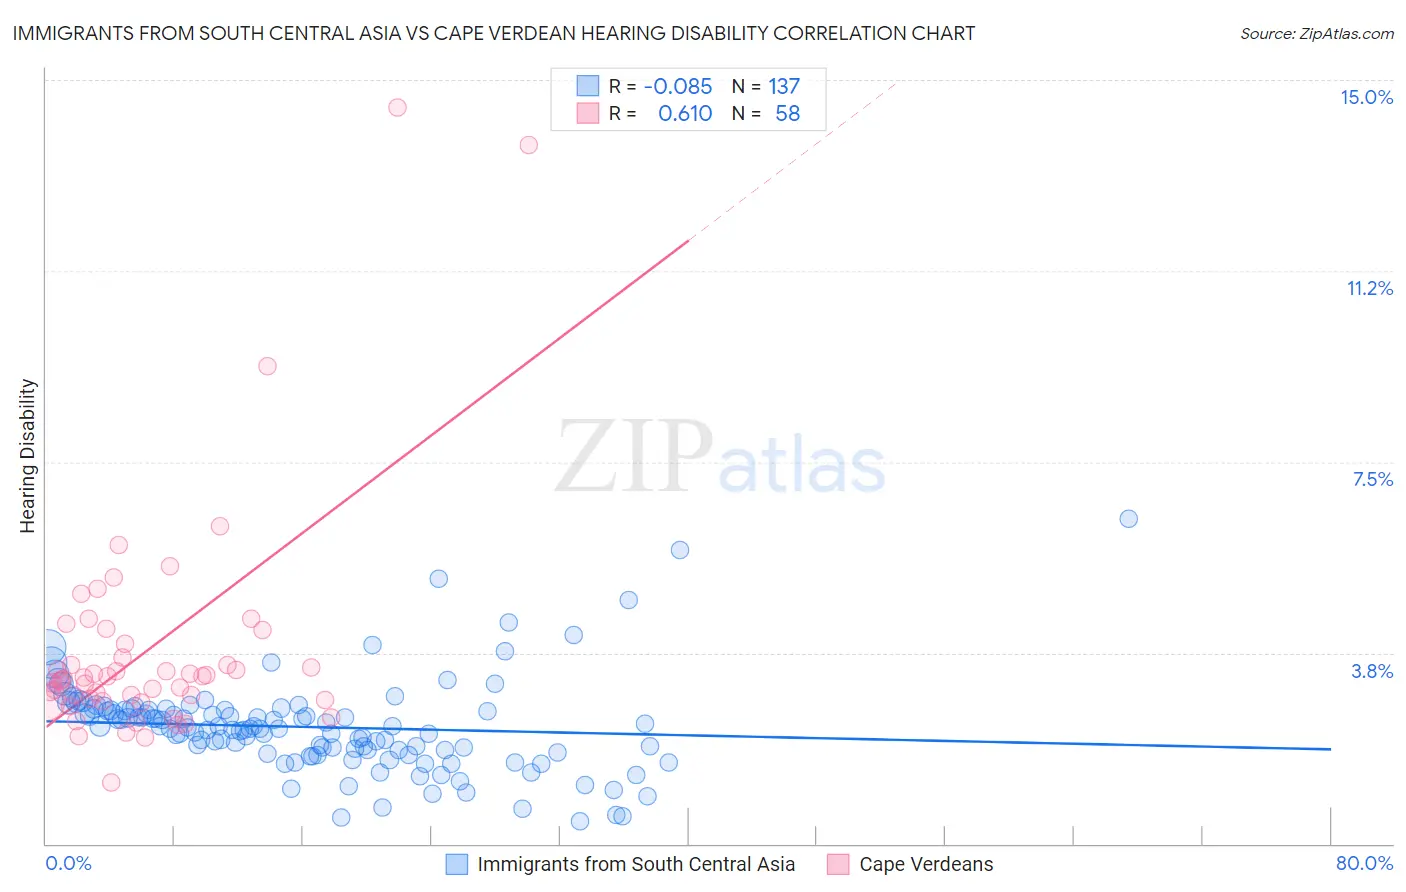
Immigrants from South Central Asia vs Cape Verdean Hearing Disability Correlation Chart
The statistical analysis conducted on geographies consisting of 472,823,945 people shows a slight negative correlation between the proportion of Immigrants from South Central Asia and percentage of population with hearing disability in the United States with a correlation coefficient (R) of -0.085 and weighted average of 2.6%. Similarly, the statistical analysis conducted on geographies consisting of 107,552,896 people shows a significant positive correlation between the proportion of Cape Verdeans and percentage of population with hearing disability in the United States with a correlation coefficient (R) of 0.610 and weighted average of 3.1%, a difference of 21.4%.
Hearing Disability Correlation Summary
| Measurement | Immigrants from South Central Asia | Cape Verdean |
| Minimum | 0.44% | 1.2% |
| Maximum | 6.4% | 14.5% |
| Range | 5.9% | 13.2% |
| Mean | 2.3% | 3.8% |
| Median | 2.3% | 3.2% |
| Interquartile 25% (IQ1) | 1.8% | 2.8% |
| Interquartile 75% (IQ3) | 2.6% | 3.9% |
| Interquartile Range (IQR) | 0.81% | 1.1% |
| Standard Deviation (Sample) | 0.91% | 2.3% |
| Standard Deviation (Population) | 0.91% | 2.3% |
Similar Demographics by Hearing Disability
Demographics Similar to Immigrants from South Central Asia by Hearing Disability
In terms of hearing disability, the demographic groups most similar to Immigrants from South Central Asia are Immigrants from Senegal (2.6%, a difference of 0.040%), Immigrants from El Salvador (2.6%, a difference of 0.050%), Immigrants from Haiti (2.6%, a difference of 0.37%), Bolivian (2.6%, a difference of 0.40%), and Immigrants from Ghana (2.6%, a difference of 0.45%).
| Demographics | Rating | Rank | Hearing Disability |
| Immigrants | Bolivia | 99.8 /100 | #20 | Exceptional 2.5% |
| Ghanaians | 99.8 /100 | #21 | Exceptional 2.5% |
| Immigrants | Sierra Leone | 99.8 /100 | #22 | Exceptional 2.6% |
| Immigrants | Nigeria | 99.8 /100 | #23 | Exceptional 2.6% |
| Immigrants | Ghana | 99.8 /100 | #24 | Exceptional 2.6% |
| Immigrants | El Salvador | 99.7 /100 | #25 | Exceptional 2.6% |
| Immigrants | Senegal | 99.7 /100 | #26 | Exceptional 2.6% |
| Immigrants | South Central Asia | 99.7 /100 | #27 | Exceptional 2.6% |
| Immigrants | Haiti | 99.7 /100 | #28 | Exceptional 2.6% |
| Bolivians | 99.7 /100 | #29 | Exceptional 2.6% |
| Immigrants | Caribbean | 99.7 /100 | #30 | Exceptional 2.6% |
| Immigrants | Cameroon | 99.7 /100 | #31 | Exceptional 2.6% |
| Immigrants | Venezuela | 99.7 /100 | #32 | Exceptional 2.6% |
| Filipinos | 99.6 /100 | #33 | Exceptional 2.6% |
| Immigrants | Pakistan | 99.6 /100 | #34 | Exceptional 2.6% |
Demographics Similar to Cape Verdeans by Hearing Disability
In terms of hearing disability, the demographic groups most similar to Cape Verdeans are Romanian (3.1%, a difference of 0.040%), Immigrants from Hungary (3.1%, a difference of 0.050%), Immigrants from Latvia (3.1%, a difference of 0.090%), Pakistani (3.1%, a difference of 0.25%), and Immigrants from Iraq (3.1%, a difference of 0.39%).
| Demographics | Rating | Rank | Hearing Disability |
| Immigrants | Denmark | 16.2 /100 | #203 | Poor 3.1% |
| Immigrants | Czechoslovakia | 15.9 /100 | #204 | Poor 3.1% |
| Alsatians | 15.9 /100 | #205 | Poor 3.1% |
| Eastern Europeans | 15.5 /100 | #206 | Poor 3.1% |
| Hispanics or Latinos | 15.1 /100 | #207 | Poor 3.1% |
| Immigrants | Latvia | 12.7 /100 | #208 | Poor 3.1% |
| Immigrants | Hungary | 12.5 /100 | #209 | Poor 3.1% |
| Cape Verdeans | 12.2 /100 | #210 | Poor 3.1% |
| Romanians | 12.1 /100 | #211 | Poor 3.1% |
| Pakistanis | 11.1 /100 | #212 | Poor 3.1% |
| Immigrants | Iraq | 10.5 /100 | #213 | Poor 3.1% |
| Australians | 8.1 /100 | #214 | Tragic 3.2% |
| Bangladeshis | 8.1 /100 | #215 | Tragic 3.2% |
| Immigrants | Norway | 7.3 /100 | #216 | Tragic 3.2% |
| Russians | 7.1 /100 | #217 | Tragic 3.2% |