Senegalese vs Cape Verdean Hearing Disability
COMPARE
Senegalese
Cape Verdean
Hearing Disability
Hearing Disability Comparison
Senegalese
Cape Verdeans
2.6%
HEARING DISABILITY
99.4/ 100
METRIC RATING
43rd/ 347
METRIC RANK
3.1%
HEARING DISABILITY
12.2/ 100
METRIC RATING
210th/ 347
METRIC RANK
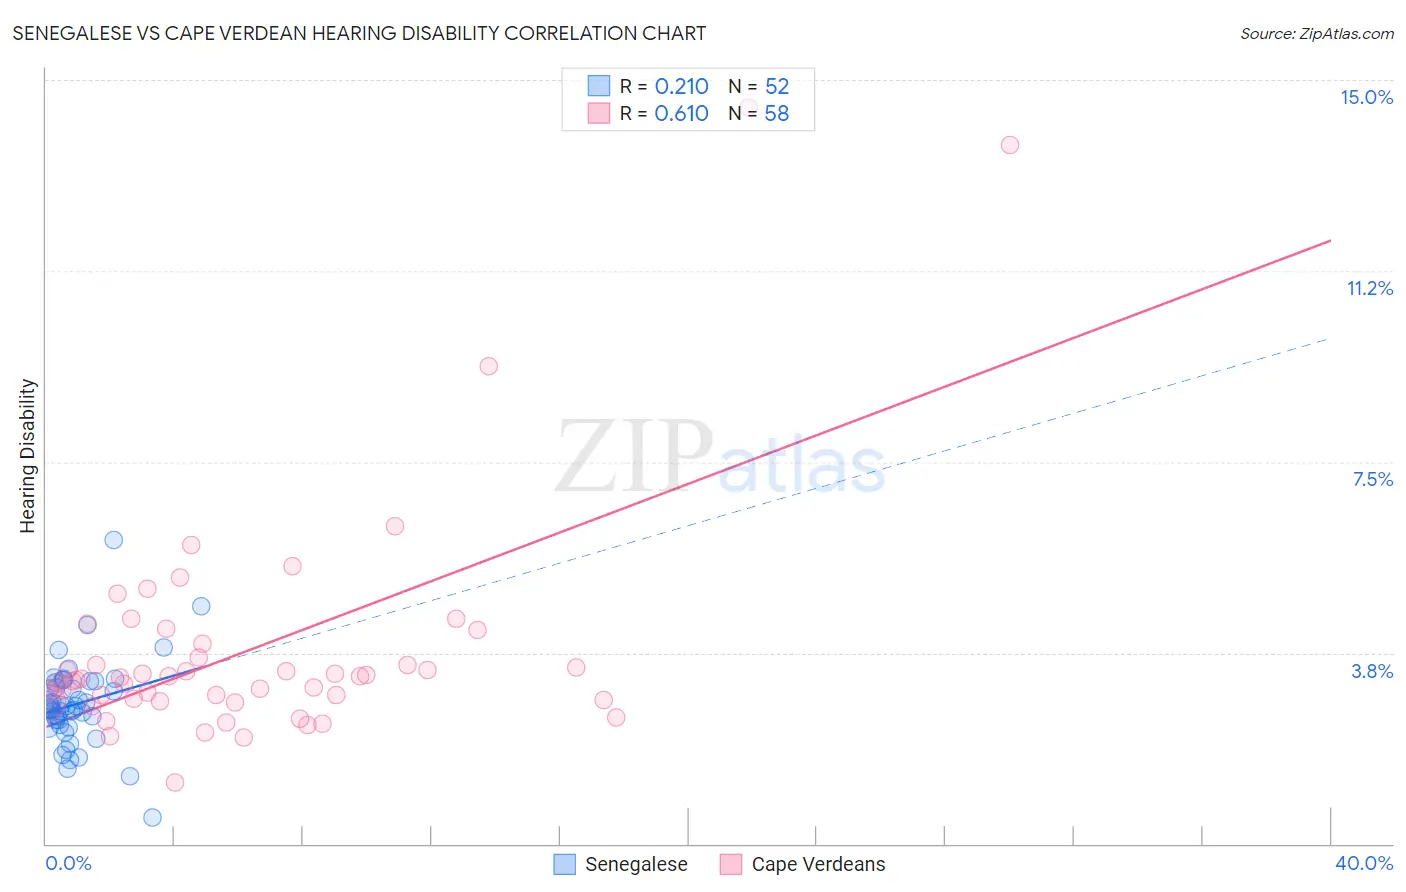
Senegalese vs Cape Verdean Hearing Disability Correlation Chart
The statistical analysis conducted on geographies consisting of 78,133,059 people shows a weak positive correlation between the proportion of Senegalese and percentage of population with hearing disability in the United States with a correlation coefficient (R) of 0.210 and weighted average of 2.6%. Similarly, the statistical analysis conducted on geographies consisting of 107,552,896 people shows a significant positive correlation between the proportion of Cape Verdeans and percentage of population with hearing disability in the United States with a correlation coefficient (R) of 0.610 and weighted average of 3.1%, a difference of 18.9%.
Hearing Disability Correlation Summary
| Measurement | Senegalese | Cape Verdean |
| Minimum | 0.50% | 1.2% |
| Maximum | 6.0% | 14.5% |
| Range | 5.5% | 13.2% |
| Mean | 2.7% | 3.8% |
| Median | 2.7% | 3.2% |
| Interquartile 25% (IQ1) | 2.4% | 2.8% |
| Interquartile 75% (IQ3) | 3.2% | 3.9% |
| Interquartile Range (IQR) | 0.80% | 1.1% |
| Standard Deviation (Sample) | 0.85% | 2.3% |
| Standard Deviation (Population) | 0.84% | 2.3% |
Similar Demographics by Hearing Disability
Demographics Similar to Senegalese by Hearing Disability
In terms of hearing disability, the demographic groups most similar to Senegalese are Immigrants from Taiwan (2.6%, a difference of 0.010%), West Indian (2.6%, a difference of 0.010%), Nigerian (2.6%, a difference of 0.22%), Venezuelan (2.6%, a difference of 0.25%), and Haitian (2.6%, a difference of 0.35%).
| Demographics | Rating | Rank | Hearing Disability |
| Okinawans | 99.6 /100 | #36 | Exceptional 2.6% |
| Immigrants | Western Africa | 99.6 /100 | #37 | Exceptional 2.6% |
| Immigrants | Jamaica | 99.5 /100 | #38 | Exceptional 2.6% |
| Immigrants | China | 99.5 /100 | #39 | Exceptional 2.6% |
| Haitians | 99.5 /100 | #40 | Exceptional 2.6% |
| Immigrants | Taiwan | 99.4 /100 | #41 | Exceptional 2.6% |
| West Indians | 99.4 /100 | #42 | Exceptional 2.6% |
| Senegalese | 99.4 /100 | #43 | Exceptional 2.6% |
| Nigerians | 99.4 /100 | #44 | Exceptional 2.6% |
| Venezuelans | 99.4 /100 | #45 | Exceptional 2.6% |
| Immigrants | Dominica | 99.3 /100 | #46 | Exceptional 2.6% |
| Immigrants | Israel | 99.3 /100 | #47 | Exceptional 2.6% |
| Immigrants | Singapore | 99.3 /100 | #48 | Exceptional 2.6% |
| Immigrants | South America | 99.2 /100 | #49 | Exceptional 2.7% |
| Paraguayans | 99.2 /100 | #50 | Exceptional 2.7% |
Demographics Similar to Cape Verdeans by Hearing Disability
In terms of hearing disability, the demographic groups most similar to Cape Verdeans are Romanian (3.1%, a difference of 0.040%), Immigrants from Hungary (3.1%, a difference of 0.050%), Immigrants from Latvia (3.1%, a difference of 0.090%), Pakistani (3.1%, a difference of 0.25%), and Immigrants from Iraq (3.1%, a difference of 0.39%).
| Demographics | Rating | Rank | Hearing Disability |
| Immigrants | Denmark | 16.2 /100 | #203 | Poor 3.1% |
| Immigrants | Czechoslovakia | 15.9 /100 | #204 | Poor 3.1% |
| Alsatians | 15.9 /100 | #205 | Poor 3.1% |
| Eastern Europeans | 15.5 /100 | #206 | Poor 3.1% |
| Hispanics or Latinos | 15.1 /100 | #207 | Poor 3.1% |
| Immigrants | Latvia | 12.7 /100 | #208 | Poor 3.1% |
| Immigrants | Hungary | 12.5 /100 | #209 | Poor 3.1% |
| Cape Verdeans | 12.2 /100 | #210 | Poor 3.1% |
| Romanians | 12.1 /100 | #211 | Poor 3.1% |
| Pakistanis | 11.1 /100 | #212 | Poor 3.1% |
| Immigrants | Iraq | 10.5 /100 | #213 | Poor 3.1% |
| Australians | 8.1 /100 | #214 | Tragic 3.2% |
| Bangladeshis | 8.1 /100 | #215 | Tragic 3.2% |
| Immigrants | Norway | 7.3 /100 | #216 | Tragic 3.2% |
| Russians | 7.1 /100 | #217 | Tragic 3.2% |