Immigrants from Peru vs Cape Verdean Hearing Disability
COMPARE
Immigrants from Peru
Cape Verdean
Hearing Disability
Hearing Disability Comparison
Immigrants from Peru
Cape Verdeans
2.7%
HEARING DISABILITY
98.6/ 100
METRIC RATING
58th/ 347
METRIC RANK
3.1%
HEARING DISABILITY
12.2/ 100
METRIC RATING
210th/ 347
METRIC RANK
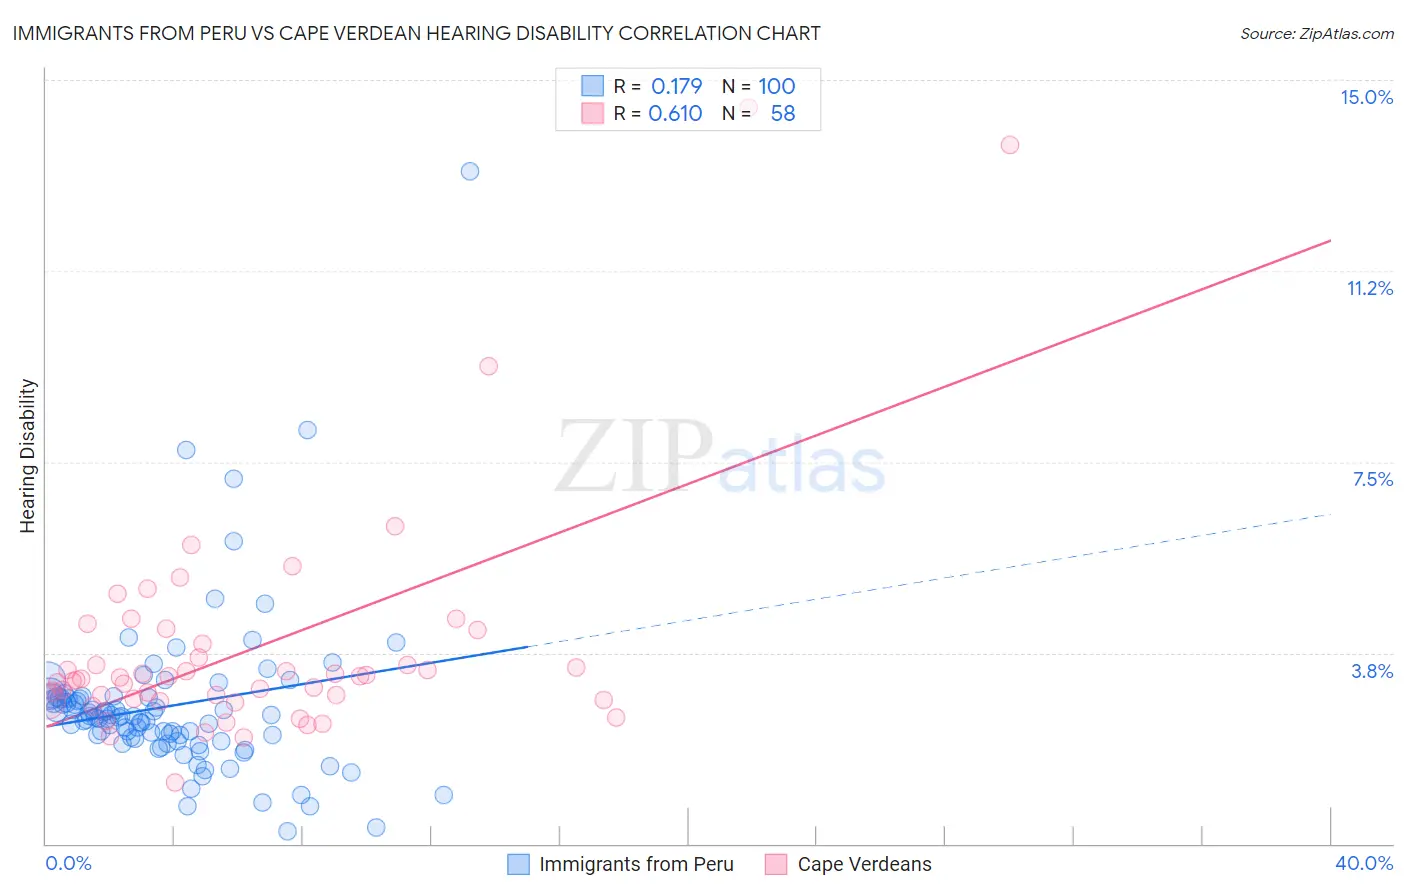
Immigrants from Peru vs Cape Verdean Hearing Disability Correlation Chart
The statistical analysis conducted on geographies consisting of 328,787,058 people shows a poor positive correlation between the proportion of Immigrants from Peru and percentage of population with hearing disability in the United States with a correlation coefficient (R) of 0.179 and weighted average of 2.7%. Similarly, the statistical analysis conducted on geographies consisting of 107,552,896 people shows a significant positive correlation between the proportion of Cape Verdeans and percentage of population with hearing disability in the United States with a correlation coefficient (R) of 0.610 and weighted average of 3.1%, a difference of 16.2%.
Hearing Disability Correlation Summary
| Measurement | Immigrants from Peru | Cape Verdean |
| Minimum | 0.24% | 1.2% |
| Maximum | 13.2% | 14.5% |
| Range | 13.0% | 13.2% |
| Mean | 2.7% | 3.8% |
| Median | 2.5% | 3.2% |
| Interquartile 25% (IQ1) | 2.0% | 2.8% |
| Interquartile 75% (IQ3) | 2.9% | 3.9% |
| Interquartile Range (IQR) | 0.85% | 1.1% |
| Standard Deviation (Sample) | 1.6% | 2.3% |
| Standard Deviation (Population) | 1.6% | 2.3% |
Similar Demographics by Hearing Disability
Demographics Similar to Immigrants from Peru by Hearing Disability
In terms of hearing disability, the demographic groups most similar to Immigrants from Peru are Immigrants from Eritrea (2.7%, a difference of 0.11%), Immigrants from Egypt (2.7%, a difference of 0.18%), Immigrants from Uzbekistan (2.7%, a difference of 0.31%), Immigrants from Colombia (2.7%, a difference of 0.32%), and Indian (Asian) (2.7%, a difference of 0.37%).
| Demographics | Rating | Rank | Hearing Disability |
| Immigrants | Hong Kong | 99.2 /100 | #51 | Exceptional 2.7% |
| Jamaicans | 99.0 /100 | #52 | Exceptional 2.7% |
| Immigrants | Eastern Asia | 99.0 /100 | #53 | Exceptional 2.7% |
| Ethiopians | 99.0 /100 | #54 | Exceptional 2.7% |
| Immigrants | Ethiopia | 99.0 /100 | #55 | Exceptional 2.7% |
| Immigrants | Nicaragua | 99.0 /100 | #56 | Exceptional 2.7% |
| South Americans | 99.0 /100 | #57 | Exceptional 2.7% |
| Immigrants | Peru | 98.6 /100 | #58 | Exceptional 2.7% |
| Immigrants | Eritrea | 98.5 /100 | #59 | Exceptional 2.7% |
| Immigrants | Egypt | 98.5 /100 | #60 | Exceptional 2.7% |
| Immigrants | Uzbekistan | 98.4 /100 | #61 | Exceptional 2.7% |
| Immigrants | Colombia | 98.4 /100 | #62 | Exceptional 2.7% |
| Indians (Asian) | 98.4 /100 | #63 | Exceptional 2.7% |
| Immigrants | Sri Lanka | 98.4 /100 | #64 | Exceptional 2.7% |
| Immigrants | Nepal | 98.3 /100 | #65 | Exceptional 2.7% |
Demographics Similar to Cape Verdeans by Hearing Disability
In terms of hearing disability, the demographic groups most similar to Cape Verdeans are Romanian (3.1%, a difference of 0.040%), Immigrants from Hungary (3.1%, a difference of 0.050%), Immigrants from Latvia (3.1%, a difference of 0.090%), Pakistani (3.1%, a difference of 0.25%), and Immigrants from Iraq (3.1%, a difference of 0.39%).
| Demographics | Rating | Rank | Hearing Disability |
| Immigrants | Denmark | 16.2 /100 | #203 | Poor 3.1% |
| Immigrants | Czechoslovakia | 15.9 /100 | #204 | Poor 3.1% |
| Alsatians | 15.9 /100 | #205 | Poor 3.1% |
| Eastern Europeans | 15.5 /100 | #206 | Poor 3.1% |
| Hispanics or Latinos | 15.1 /100 | #207 | Poor 3.1% |
| Immigrants | Latvia | 12.7 /100 | #208 | Poor 3.1% |
| Immigrants | Hungary | 12.5 /100 | #209 | Poor 3.1% |
| Cape Verdeans | 12.2 /100 | #210 | Poor 3.1% |
| Romanians | 12.1 /100 | #211 | Poor 3.1% |
| Pakistanis | 11.1 /100 | #212 | Poor 3.1% |
| Immigrants | Iraq | 10.5 /100 | #213 | Poor 3.1% |
| Australians | 8.1 /100 | #214 | Tragic 3.2% |
| Bangladeshis | 8.1 /100 | #215 | Tragic 3.2% |
| Immigrants | Norway | 7.3 /100 | #216 | Tragic 3.2% |
| Russians | 7.1 /100 | #217 | Tragic 3.2% |