Greek vs Immigrants from Western Africa Female Disability
COMPARE
Greek
Immigrants from Western Africa
Female Disability
Female Disability Comparison
Greeks
Immigrants from Western Africa
12.0%
FEMALE DISABILITY
82.0/ 100
METRIC RATING
149th/ 347
METRIC RANK
12.3%
FEMALE DISABILITY
29.2/ 100
METRIC RATING
192nd/ 347
METRIC RANK
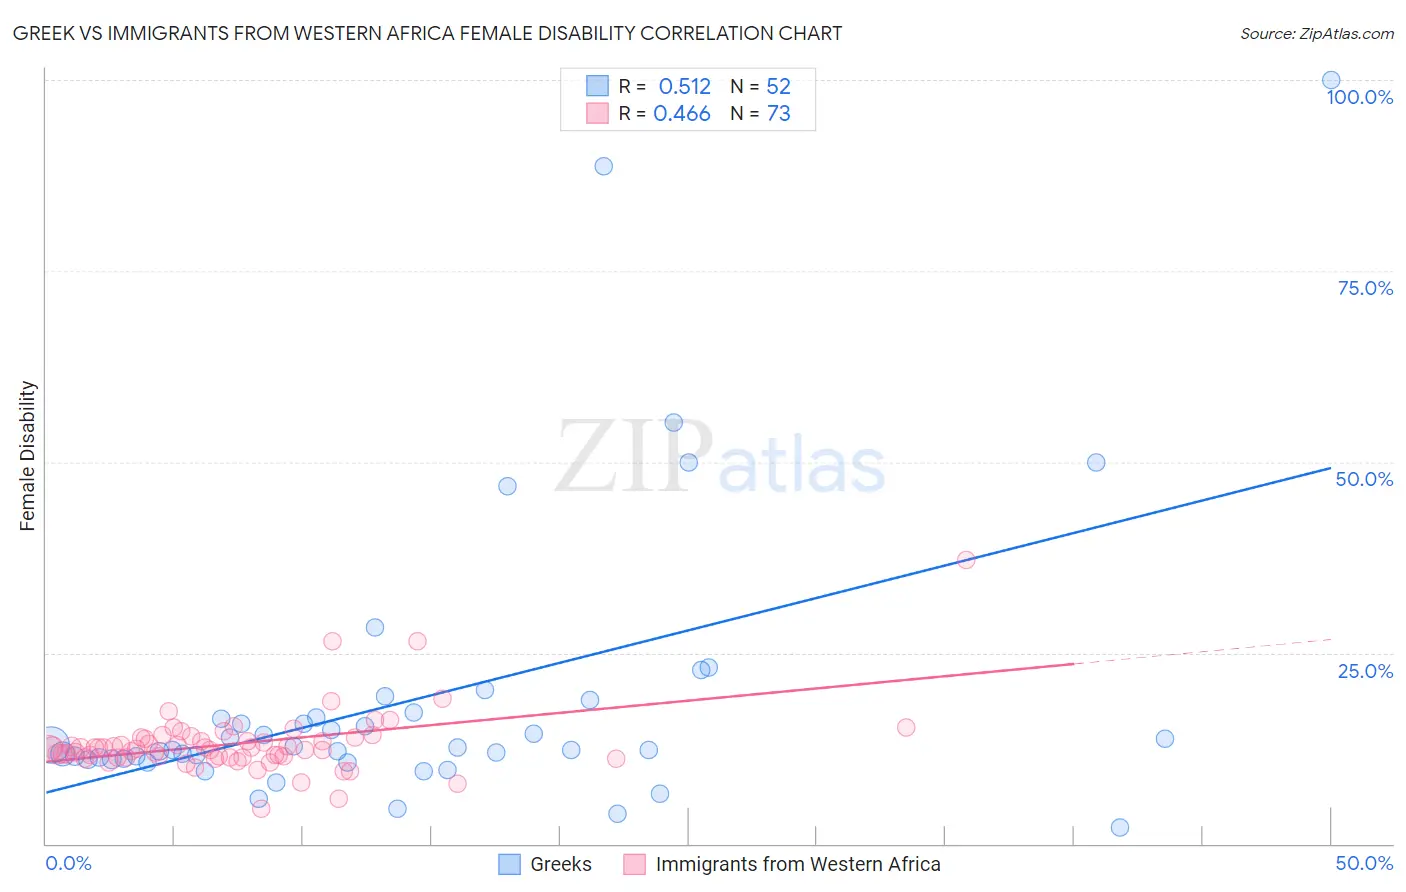
Greek vs Immigrants from Western Africa Female Disability Correlation Chart
The statistical analysis conducted on geographies consisting of 482,678,475 people shows a substantial positive correlation between the proportion of Greeks and percentage of females with a disability in the United States with a correlation coefficient (R) of 0.512 and weighted average of 12.0%. Similarly, the statistical analysis conducted on geographies consisting of 357,800,651 people shows a moderate positive correlation between the proportion of Immigrants from Western Africa and percentage of females with a disability in the United States with a correlation coefficient (R) of 0.466 and weighted average of 12.3%, a difference of 2.3%.
Female Disability Correlation Summary
| Measurement | Greek | Immigrants from Western Africa |
| Minimum | 2.2% | 4.6% |
| Maximum | 100.0% | 37.1% |
| Range | 97.8% | 32.5% |
| Mean | 19.0% | 13.1% |
| Median | 12.5% | 12.5% |
| Interquartile 25% (IQ1) | 11.1% | 11.3% |
| Interquartile 75% (IQ3) | 16.9% | 13.9% |
| Interquartile Range (IQR) | 5.8% | 2.6% |
| Standard Deviation (Sample) | 18.9% | 4.4% |
| Standard Deviation (Population) | 18.7% | 4.3% |
Similar Demographics by Female Disability
Demographics Similar to Greeks by Female Disability
In terms of female disability, the demographic groups most similar to Greeks are Immigrants from Moldova (12.0%, a difference of 0.030%), Immigrants from Kenya (12.0%, a difference of 0.070%), Icelander (12.0%, a difference of 0.080%), Nigerian (12.0%, a difference of 0.14%), and Immigrants from Scotland (12.0%, a difference of 0.16%).
| Demographics | Rating | Rank | Female Disability |
| Immigrants | Africa | 90.0 /100 | #142 | Excellent 11.9% |
| Immigrants | Sudan | 89.6 /100 | #143 | Excellent 11.9% |
| Immigrants | Austria | 87.9 /100 | #144 | Excellent 12.0% |
| Estonians | 87.8 /100 | #145 | Excellent 12.0% |
| Pakistanis | 84.6 /100 | #146 | Excellent 12.0% |
| Nigerians | 84.0 /100 | #147 | Excellent 12.0% |
| Immigrants | Kenya | 83.1 /100 | #148 | Excellent 12.0% |
| Greeks | 82.0 /100 | #149 | Excellent 12.0% |
| Immigrants | Moldova | 81.4 /100 | #150 | Excellent 12.0% |
| Icelanders | 80.7 /100 | #151 | Excellent 12.0% |
| Immigrants | Scotland | 79.3 /100 | #152 | Good 12.0% |
| Sudanese | 79.1 /100 | #153 | Good 12.0% |
| Syrians | 76.9 /100 | #154 | Good 12.1% |
| Ghanaians | 76.6 /100 | #155 | Good 12.1% |
| Moroccans | 72.9 /100 | #156 | Good 12.1% |
Demographics Similar to Immigrants from Western Africa by Female Disability
In terms of female disability, the demographic groups most similar to Immigrants from Western Africa are Armenian (12.3%, a difference of 0.020%), Northern European (12.3%, a difference of 0.080%), Immigrants from Honduras (12.3%, a difference of 0.090%), Ukrainian (12.3%, a difference of 0.090%), and Immigrants from Albania (12.3%, a difference of 0.10%).
| Demographics | Rating | Rank | Female Disability |
| Immigrants | Uzbekistan | 33.9 /100 | #185 | Fair 12.3% |
| Austrians | 33.3 /100 | #186 | Fair 12.3% |
| Serbians | 33.1 /100 | #187 | Fair 12.3% |
| Immigrants | North America | 32.8 /100 | #188 | Fair 12.3% |
| Immigrants | Albania | 31.6 /100 | #189 | Fair 12.3% |
| Immigrants | Honduras | 31.3 /100 | #190 | Fair 12.3% |
| Armenians | 29.7 /100 | #191 | Fair 12.3% |
| Immigrants | Western Africa | 29.2 /100 | #192 | Fair 12.3% |
| Northern Europeans | 27.5 /100 | #193 | Fair 12.3% |
| Ukrainians | 27.2 /100 | #194 | Fair 12.3% |
| Swedes | 26.6 /100 | #195 | Fair 12.3% |
| Immigrants | Panama | 25.5 /100 | #196 | Fair 12.3% |
| Hondurans | 25.4 /100 | #197 | Fair 12.3% |
| Mexican American Indians | 24.9 /100 | #198 | Fair 12.3% |
| Immigrants | Trinidad and Tobago | 24.7 /100 | #199 | Fair 12.3% |