Greek vs Black/African American Female Disability
COMPARE
Greek
Black/African American
Female Disability
Female Disability Comparison
Greeks
Blacks/African Americans
12.0%
FEMALE DISABILITY
82.0/ 100
METRIC RATING
149th/ 347
METRIC RANK
14.1%
FEMALE DISABILITY
0.0/ 100
METRIC RATING
323rd/ 347
METRIC RANK
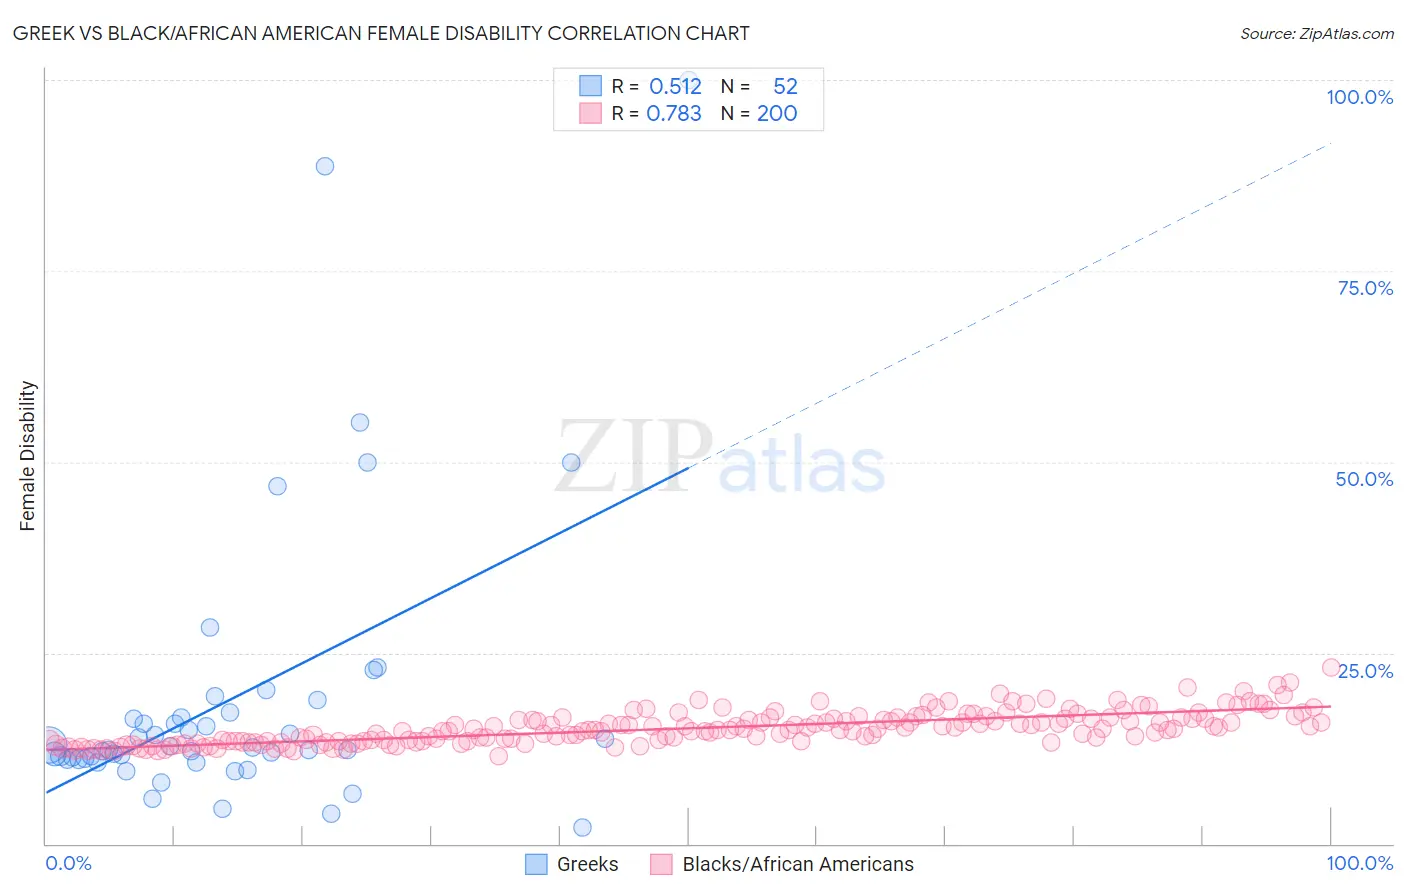
Greek vs Black/African American Female Disability Correlation Chart
The statistical analysis conducted on geographies consisting of 482,678,475 people shows a substantial positive correlation between the proportion of Greeks and percentage of females with a disability in the United States with a correlation coefficient (R) of 0.512 and weighted average of 12.0%. Similarly, the statistical analysis conducted on geographies consisting of 565,768,097 people shows a strong positive correlation between the proportion of Blacks/African Americans and percentage of females with a disability in the United States with a correlation coefficient (R) of 0.783 and weighted average of 14.1%, a difference of 17.6%.
Female Disability Correlation Summary
| Measurement | Greek | Black/African American |
| Minimum | 2.2% | 11.4% |
| Maximum | 100.0% | 23.1% |
| Range | 97.8% | 11.6% |
| Mean | 19.0% | 15.1% |
| Median | 12.5% | 14.9% |
| Interquartile 25% (IQ1) | 11.1% | 13.4% |
| Interquartile 75% (IQ3) | 16.9% | 16.4% |
| Interquartile Range (IQR) | 5.8% | 3.0% |
| Standard Deviation (Sample) | 18.9% | 2.1% |
| Standard Deviation (Population) | 18.7% | 2.1% |
Similar Demographics by Female Disability
Demographics Similar to Greeks by Female Disability
In terms of female disability, the demographic groups most similar to Greeks are Immigrants from Moldova (12.0%, a difference of 0.030%), Immigrants from Kenya (12.0%, a difference of 0.070%), Icelander (12.0%, a difference of 0.080%), Nigerian (12.0%, a difference of 0.14%), and Immigrants from Scotland (12.0%, a difference of 0.16%).
| Demographics | Rating | Rank | Female Disability |
| Immigrants | Africa | 90.0 /100 | #142 | Excellent 11.9% |
| Immigrants | Sudan | 89.6 /100 | #143 | Excellent 11.9% |
| Immigrants | Austria | 87.9 /100 | #144 | Excellent 12.0% |
| Estonians | 87.8 /100 | #145 | Excellent 12.0% |
| Pakistanis | 84.6 /100 | #146 | Excellent 12.0% |
| Nigerians | 84.0 /100 | #147 | Excellent 12.0% |
| Immigrants | Kenya | 83.1 /100 | #148 | Excellent 12.0% |
| Greeks | 82.0 /100 | #149 | Excellent 12.0% |
| Immigrants | Moldova | 81.4 /100 | #150 | Excellent 12.0% |
| Icelanders | 80.7 /100 | #151 | Excellent 12.0% |
| Immigrants | Scotland | 79.3 /100 | #152 | Good 12.0% |
| Sudanese | 79.1 /100 | #153 | Good 12.0% |
| Syrians | 76.9 /100 | #154 | Good 12.1% |
| Ghanaians | 76.6 /100 | #155 | Good 12.1% |
| Moroccans | 72.9 /100 | #156 | Good 12.1% |
Demographics Similar to Blacks/African Americans by Female Disability
In terms of female disability, the demographic groups most similar to Blacks/African Americans are Native/Alaskan (14.1%, a difference of 0.020%), Navajo (14.2%, a difference of 0.16%), Pueblo (14.1%, a difference of 0.17%), Potawatomi (14.1%, a difference of 0.18%), and Comanche (14.2%, a difference of 0.27%).
| Demographics | Rating | Rank | Female Disability |
| Spanish Americans | 0.0 /100 | #316 | Tragic 14.0% |
| Chippewa | 0.0 /100 | #317 | Tragic 14.0% |
| Paiute | 0.0 /100 | #318 | Tragic 14.0% |
| Iroquois | 0.0 /100 | #319 | Tragic 14.0% |
| Americans | 0.0 /100 | #320 | Tragic 14.1% |
| Potawatomi | 0.0 /100 | #321 | Tragic 14.1% |
| Pueblo | 0.0 /100 | #322 | Tragic 14.1% |
| Blacks/African Americans | 0.0 /100 | #323 | Tragic 14.1% |
| Natives/Alaskans | 0.0 /100 | #324 | Tragic 14.1% |
| Navajo | 0.0 /100 | #325 | Tragic 14.2% |
| Comanche | 0.0 /100 | #326 | Tragic 14.2% |
| Ottawa | 0.0 /100 | #327 | Tragic 14.2% |
| Cape Verdeans | 0.0 /100 | #328 | Tragic 14.2% |
| Osage | 0.0 /100 | #329 | Tragic 14.3% |
| Yuman | 0.0 /100 | #330 | Tragic 14.5% |