Greek vs Immigrants from Haiti Cognitive Disability
COMPARE
Greek
Immigrants from Haiti
Cognitive Disability
Cognitive Disability Comparison
Greeks
Immigrants from Haiti
16.4%
COGNITIVE DISABILITY
99.9/ 100
METRIC RATING
36th/ 347
METRIC RANK
17.4%
COGNITIVE DISABILITY
27.1/ 100
METRIC RATING
192nd/ 347
METRIC RANK
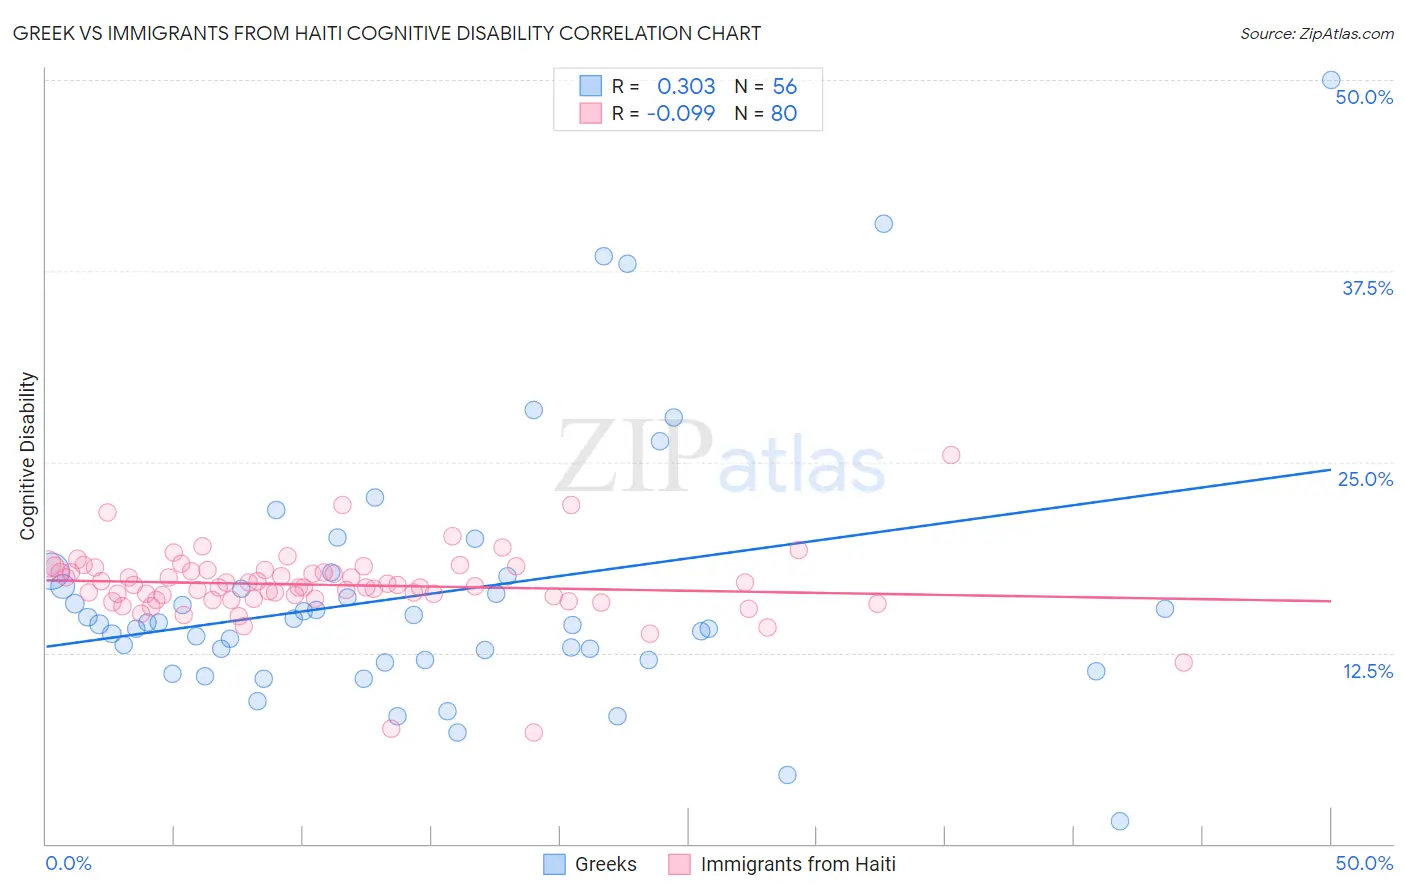
Greek vs Immigrants from Haiti Cognitive Disability Correlation Chart
The statistical analysis conducted on geographies consisting of 482,712,046 people shows a mild positive correlation between the proportion of Greeks and percentage of population with cognitive disability in the United States with a correlation coefficient (R) of 0.303 and weighted average of 16.4%. Similarly, the statistical analysis conducted on geographies consisting of 225,240,715 people shows a slight negative correlation between the proportion of Immigrants from Haiti and percentage of population with cognitive disability in the United States with a correlation coefficient (R) of -0.099 and weighted average of 17.4%, a difference of 5.9%.
Cognitive Disability Correlation Summary
| Measurement | Greek | Immigrants from Haiti |
| Minimum | 1.5% | 7.3% |
| Maximum | 50.0% | 25.4% |
| Range | 48.5% | 18.2% |
| Mean | 16.4% | 16.9% |
| Median | 14.4% | 16.9% |
| Interquartile 25% (IQ1) | 12.0% | 16.0% |
| Interquartile 75% (IQ3) | 17.2% | 17.9% |
| Interquartile Range (IQR) | 5.2% | 1.9% |
| Standard Deviation (Sample) | 8.7% | 2.4% |
| Standard Deviation (Population) | 8.6% | 2.4% |
Similar Demographics by Cognitive Disability
Demographics Similar to Greeks by Cognitive Disability
In terms of cognitive disability, the demographic groups most similar to Greeks are Slovak (16.4%, a difference of 0.010%), Italian (16.4%, a difference of 0.090%), Russian (16.4%, a difference of 0.090%), Slovene (16.5%, a difference of 0.15%), and Immigrants from Israel (16.4%, a difference of 0.16%).
| Demographics | Rating | Rank | Cognitive Disability |
| Filipinos | 99.9 /100 | #29 | Exceptional 16.4% |
| Czechs | 99.9 /100 | #30 | Exceptional 16.4% |
| Immigrants | Romania | 99.9 /100 | #31 | Exceptional 16.4% |
| Immigrants | Israel | 99.9 /100 | #32 | Exceptional 16.4% |
| Italians | 99.9 /100 | #33 | Exceptional 16.4% |
| Russians | 99.9 /100 | #34 | Exceptional 16.4% |
| Slovaks | 99.9 /100 | #35 | Exceptional 16.4% |
| Greeks | 99.9 /100 | #36 | Exceptional 16.4% |
| Slovenes | 99.9 /100 | #37 | Exceptional 16.5% |
| Immigrants | Eastern Europe | 99.9 /100 | #38 | Exceptional 16.5% |
| Bolivians | 99.9 /100 | #39 | Exceptional 16.5% |
| Immigrants | Belarus | 99.9 /100 | #40 | Exceptional 16.5% |
| Cubans | 99.9 /100 | #41 | Exceptional 16.5% |
| Hungarians | 99.9 /100 | #42 | Exceptional 16.5% |
| Immigrants | Canada | 99.8 /100 | #43 | Exceptional 16.5% |
Demographics Similar to Immigrants from Haiti by Cognitive Disability
In terms of cognitive disability, the demographic groups most similar to Immigrants from Haiti are Nonimmigrants (17.4%, a difference of 0.010%), Immigrants from Spain (17.4%, a difference of 0.020%), Delaware (17.4%, a difference of 0.050%), Immigrants from Western Asia (17.4%, a difference of 0.080%), and Immigrants from France (17.4%, a difference of 0.090%).
| Demographics | Rating | Rank | Cognitive Disability |
| Afghans | 38.2 /100 | #185 | Fair 17.3% |
| Cambodians | 35.9 /100 | #186 | Fair 17.3% |
| Immigrants | Fiji | 33.7 /100 | #187 | Fair 17.4% |
| Immigrants | France | 29.8 /100 | #188 | Fair 17.4% |
| Immigrants | Western Asia | 29.5 /100 | #189 | Fair 17.4% |
| Immigrants | Spain | 27.7 /100 | #190 | Fair 17.4% |
| Immigrants | Nonimmigrants | 27.4 /100 | #191 | Fair 17.4% |
| Immigrants | Haiti | 27.1 /100 | #192 | Fair 17.4% |
| Delaware | 25.6 /100 | #193 | Fair 17.4% |
| Immigrants | Bosnia and Herzegovina | 22.0 /100 | #194 | Fair 17.4% |
| New Zealanders | 21.1 /100 | #195 | Fair 17.4% |
| Guyanese | 17.5 /100 | #196 | Poor 17.5% |
| Immigrants | Afghanistan | 16.7 /100 | #197 | Poor 17.5% |
| Immigrants | Panama | 14.8 /100 | #198 | Poor 17.5% |
| Immigrants | Singapore | 14.3 /100 | #199 | Poor 17.5% |