Greek vs Macedonian Cognitive Disability
COMPARE
Greek
Macedonian
Cognitive Disability
Cognitive Disability Comparison
Greeks
Macedonians
16.4%
COGNITIVE DISABILITY
99.9/ 100
METRIC RATING
36th/ 347
METRIC RANK
16.5%
COGNITIVE DISABILITY
99.8/ 100
METRIC RATING
44th/ 347
METRIC RANK
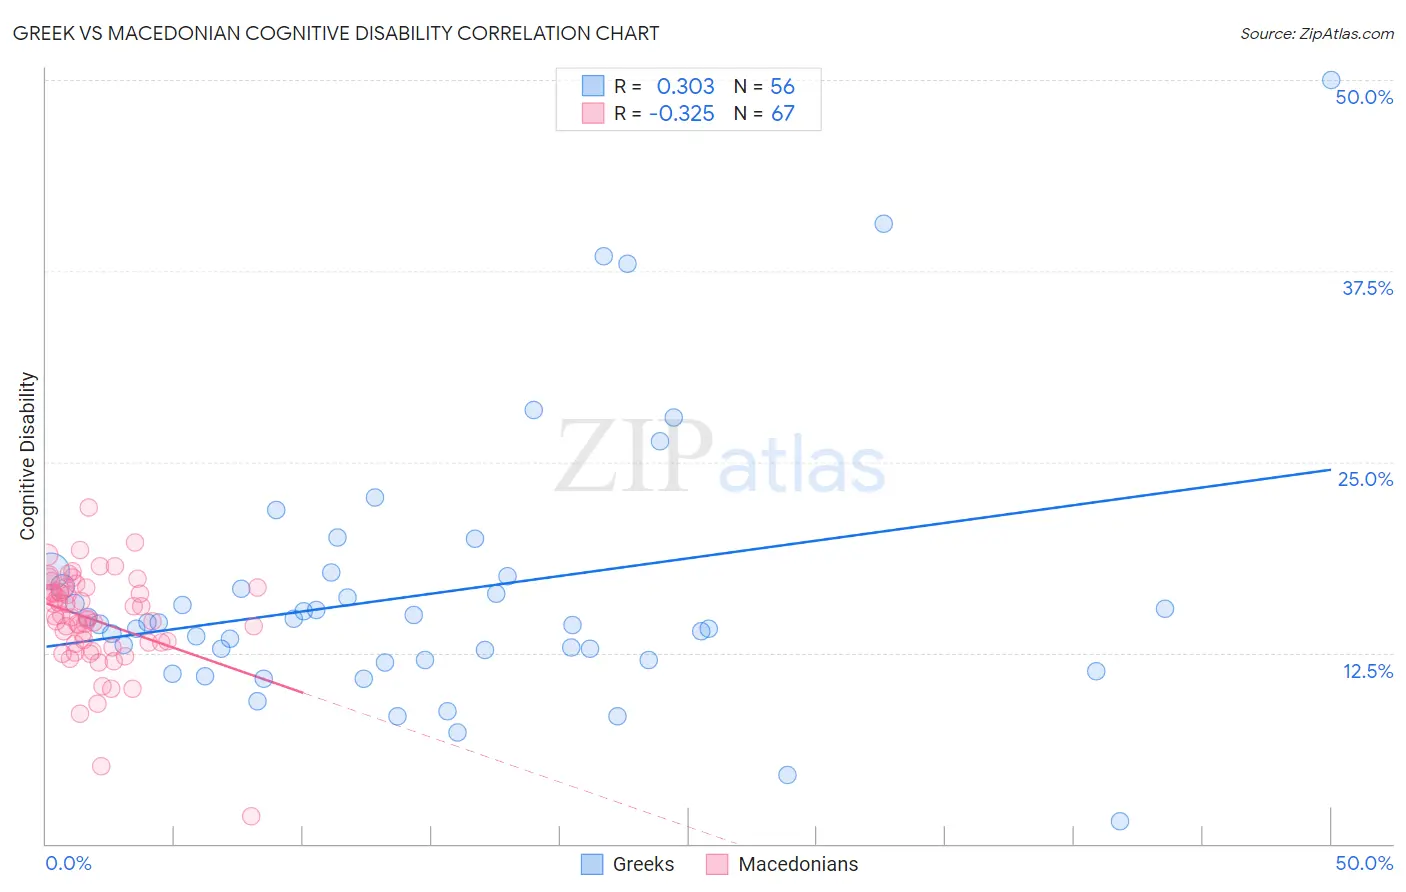
Greek vs Macedonian Cognitive Disability Correlation Chart
The statistical analysis conducted on geographies consisting of 482,712,046 people shows a mild positive correlation between the proportion of Greeks and percentage of population with cognitive disability in the United States with a correlation coefficient (R) of 0.303 and weighted average of 16.4%. Similarly, the statistical analysis conducted on geographies consisting of 132,658,895 people shows a mild negative correlation between the proportion of Macedonians and percentage of population with cognitive disability in the United States with a correlation coefficient (R) of -0.325 and weighted average of 16.5%, a difference of 0.36%.
Cognitive Disability Correlation Summary
| Measurement | Greek | Macedonian |
| Minimum | 1.5% | 1.8% |
| Maximum | 50.0% | 22.0% |
| Range | 48.5% | 20.2% |
| Mean | 16.4% | 14.6% |
| Median | 14.4% | 14.8% |
| Interquartile 25% (IQ1) | 12.0% | 13.1% |
| Interquartile 75% (IQ3) | 17.2% | 16.8% |
| Interquartile Range (IQR) | 5.2% | 3.7% |
| Standard Deviation (Sample) | 8.7% | 3.2% |
| Standard Deviation (Population) | 8.6% | 3.2% |
Demographics Similar to Greeks and Macedonians by Cognitive Disability
In terms of cognitive disability, the demographic groups most similar to Greeks are Slovak (16.4%, a difference of 0.010%), Italian (16.4%, a difference of 0.090%), Russian (16.4%, a difference of 0.090%), Slovene (16.5%, a difference of 0.15%), and Immigrants from Israel (16.4%, a difference of 0.16%). Similarly, the demographic groups most similar to Macedonians are Immigrants from Europe (16.5%, a difference of 0.010%), Immigrants from Colombia (16.5%, a difference of 0.020%), Immigrants from Canada (16.5%, a difference of 0.030%), Immigrants from Italy (16.5%, a difference of 0.050%), and Immigrants from North America (16.5%, a difference of 0.050%).
| Demographics | Rating | Rank | Cognitive Disability |
| Czechs | 99.9 /100 | #30 | Exceptional 16.4% |
| Immigrants | Romania | 99.9 /100 | #31 | Exceptional 16.4% |
| Immigrants | Israel | 99.9 /100 | #32 | Exceptional 16.4% |
| Italians | 99.9 /100 | #33 | Exceptional 16.4% |
| Russians | 99.9 /100 | #34 | Exceptional 16.4% |
| Slovaks | 99.9 /100 | #35 | Exceptional 16.4% |
| Greeks | 99.9 /100 | #36 | Exceptional 16.4% |
| Slovenes | 99.9 /100 | #37 | Exceptional 16.5% |
| Immigrants | Eastern Europe | 99.9 /100 | #38 | Exceptional 16.5% |
| Bolivians | 99.9 /100 | #39 | Exceptional 16.5% |
| Immigrants | Belarus | 99.9 /100 | #40 | Exceptional 16.5% |
| Cubans | 99.9 /100 | #41 | Exceptional 16.5% |
| Hungarians | 99.9 /100 | #42 | Exceptional 16.5% |
| Immigrants | Canada | 99.8 /100 | #43 | Exceptional 16.5% |
| Macedonians | 99.8 /100 | #44 | Exceptional 16.5% |
| Immigrants | Europe | 99.8 /100 | #45 | Exceptional 16.5% |
| Immigrants | Colombia | 99.8 /100 | #46 | Exceptional 16.5% |
| Immigrants | Italy | 99.8 /100 | #47 | Exceptional 16.5% |
| Immigrants | North America | 99.8 /100 | #48 | Exceptional 16.5% |
| Iranians | 99.8 /100 | #49 | Exceptional 16.5% |
| Norwegians | 99.8 /100 | #50 | Exceptional 16.5% |