Greek vs Barbadian Cognitive Disability
COMPARE
Greek
Barbadian
Cognitive Disability
Cognitive Disability Comparison
Greeks
Barbadians
16.4%
COGNITIVE DISABILITY
99.9/ 100
METRIC RATING
36th/ 347
METRIC RANK
18.3%
COGNITIVE DISABILITY
0.0/ 100
METRIC RATING
302nd/ 347
METRIC RANK
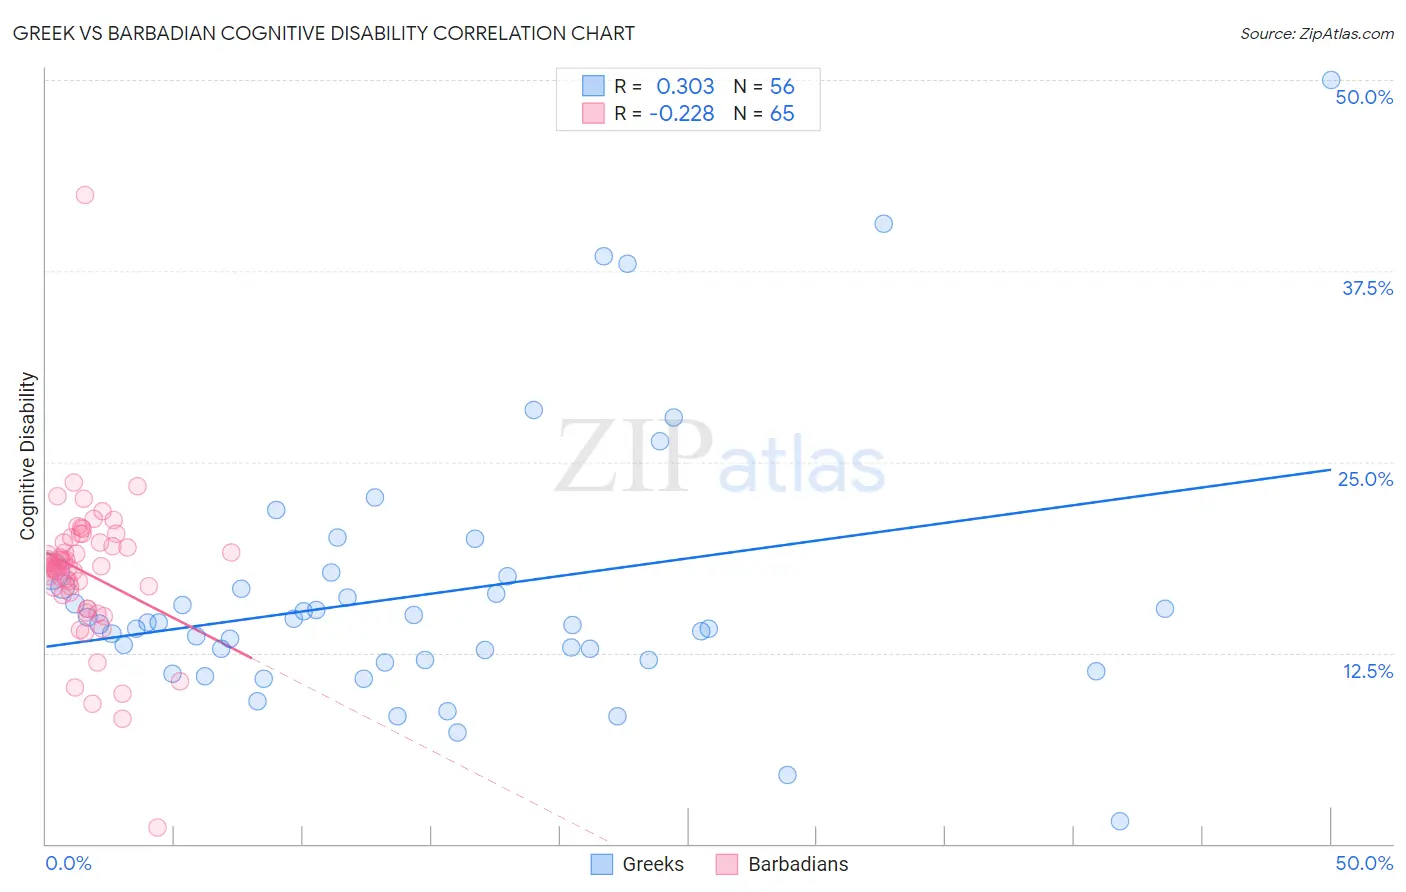
Greek vs Barbadian Cognitive Disability Correlation Chart
The statistical analysis conducted on geographies consisting of 482,712,046 people shows a mild positive correlation between the proportion of Greeks and percentage of population with cognitive disability in the United States with a correlation coefficient (R) of 0.303 and weighted average of 16.4%. Similarly, the statistical analysis conducted on geographies consisting of 141,302,702 people shows a weak negative correlation between the proportion of Barbadians and percentage of population with cognitive disability in the United States with a correlation coefficient (R) of -0.228 and weighted average of 18.3%, a difference of 11.5%.
Cognitive Disability Correlation Summary
| Measurement | Greek | Barbadian |
| Minimum | 1.5% | 1.0% |
| Maximum | 50.0% | 42.5% |
| Range | 48.5% | 41.4% |
| Mean | 16.4% | 17.8% |
| Median | 14.4% | 18.2% |
| Interquartile 25% (IQ1) | 12.0% | 16.3% |
| Interquartile 75% (IQ3) | 17.2% | 19.7% |
| Interquartile Range (IQR) | 5.2% | 3.4% |
| Standard Deviation (Sample) | 8.7% | 5.0% |
| Standard Deviation (Population) | 8.6% | 4.9% |
Similar Demographics by Cognitive Disability
Demographics Similar to Greeks by Cognitive Disability
In terms of cognitive disability, the demographic groups most similar to Greeks are Slovak (16.4%, a difference of 0.010%), Italian (16.4%, a difference of 0.090%), Russian (16.4%, a difference of 0.090%), Slovene (16.5%, a difference of 0.15%), and Immigrants from Israel (16.4%, a difference of 0.16%).
| Demographics | Rating | Rank | Cognitive Disability |
| Filipinos | 99.9 /100 | #29 | Exceptional 16.4% |
| Czechs | 99.9 /100 | #30 | Exceptional 16.4% |
| Immigrants | Romania | 99.9 /100 | #31 | Exceptional 16.4% |
| Immigrants | Israel | 99.9 /100 | #32 | Exceptional 16.4% |
| Italians | 99.9 /100 | #33 | Exceptional 16.4% |
| Russians | 99.9 /100 | #34 | Exceptional 16.4% |
| Slovaks | 99.9 /100 | #35 | Exceptional 16.4% |
| Greeks | 99.9 /100 | #36 | Exceptional 16.4% |
| Slovenes | 99.9 /100 | #37 | Exceptional 16.5% |
| Immigrants | Eastern Europe | 99.9 /100 | #38 | Exceptional 16.5% |
| Bolivians | 99.9 /100 | #39 | Exceptional 16.5% |
| Immigrants | Belarus | 99.9 /100 | #40 | Exceptional 16.5% |
| Cubans | 99.9 /100 | #41 | Exceptional 16.5% |
| Hungarians | 99.9 /100 | #42 | Exceptional 16.5% |
| Immigrants | Canada | 99.8 /100 | #43 | Exceptional 16.5% |
Demographics Similar to Barbadians by Cognitive Disability
In terms of cognitive disability, the demographic groups most similar to Barbadians are Immigrants from Kenya (18.3%, a difference of 0.010%), Immigrants from Eritrea (18.3%, a difference of 0.060%), Immigrants from Ghana (18.3%, a difference of 0.080%), Colville (18.3%, a difference of 0.18%), and Seminole (18.3%, a difference of 0.19%).
| Demographics | Rating | Rank | Cognitive Disability |
| German Russians | 0.0 /100 | #295 | Tragic 18.2% |
| Immigrants | Burma/Myanmar | 0.0 /100 | #296 | Tragic 18.2% |
| Blackfeet | 0.0 /100 | #297 | Tragic 18.3% |
| Japanese | 0.0 /100 | #298 | Tragic 18.3% |
| Ghanaians | 0.0 /100 | #299 | Tragic 18.3% |
| Creek | 0.0 /100 | #300 | Tragic 18.3% |
| Immigrants | Ghana | 0.0 /100 | #301 | Tragic 18.3% |
| Barbadians | 0.0 /100 | #302 | Tragic 18.3% |
| Immigrants | Kenya | 0.0 /100 | #303 | Tragic 18.3% |
| Immigrants | Eritrea | 0.0 /100 | #304 | Tragic 18.3% |
| Colville | 0.0 /100 | #305 | Tragic 18.3% |
| Seminole | 0.0 /100 | #306 | Tragic 18.3% |
| Ugandans | 0.0 /100 | #307 | Tragic 18.3% |
| Immigrants | Western Africa | 0.0 /100 | #308 | Tragic 18.4% |
| Immigrants | Eastern Africa | 0.0 /100 | #309 | Tragic 18.4% |