Greek vs Assyrian/Chaldean/Syriac Cognitive Disability
COMPARE
Greek
Assyrian/Chaldean/Syriac
Cognitive Disability
Cognitive Disability Comparison
Greeks
Assyrians/Chaldeans/Syriacs
16.4%
COGNITIVE DISABILITY
99.9/ 100
METRIC RATING
36th/ 347
METRIC RANK
16.2%
COGNITIVE DISABILITY
100.0/ 100
METRIC RATING
9th/ 347
METRIC RANK
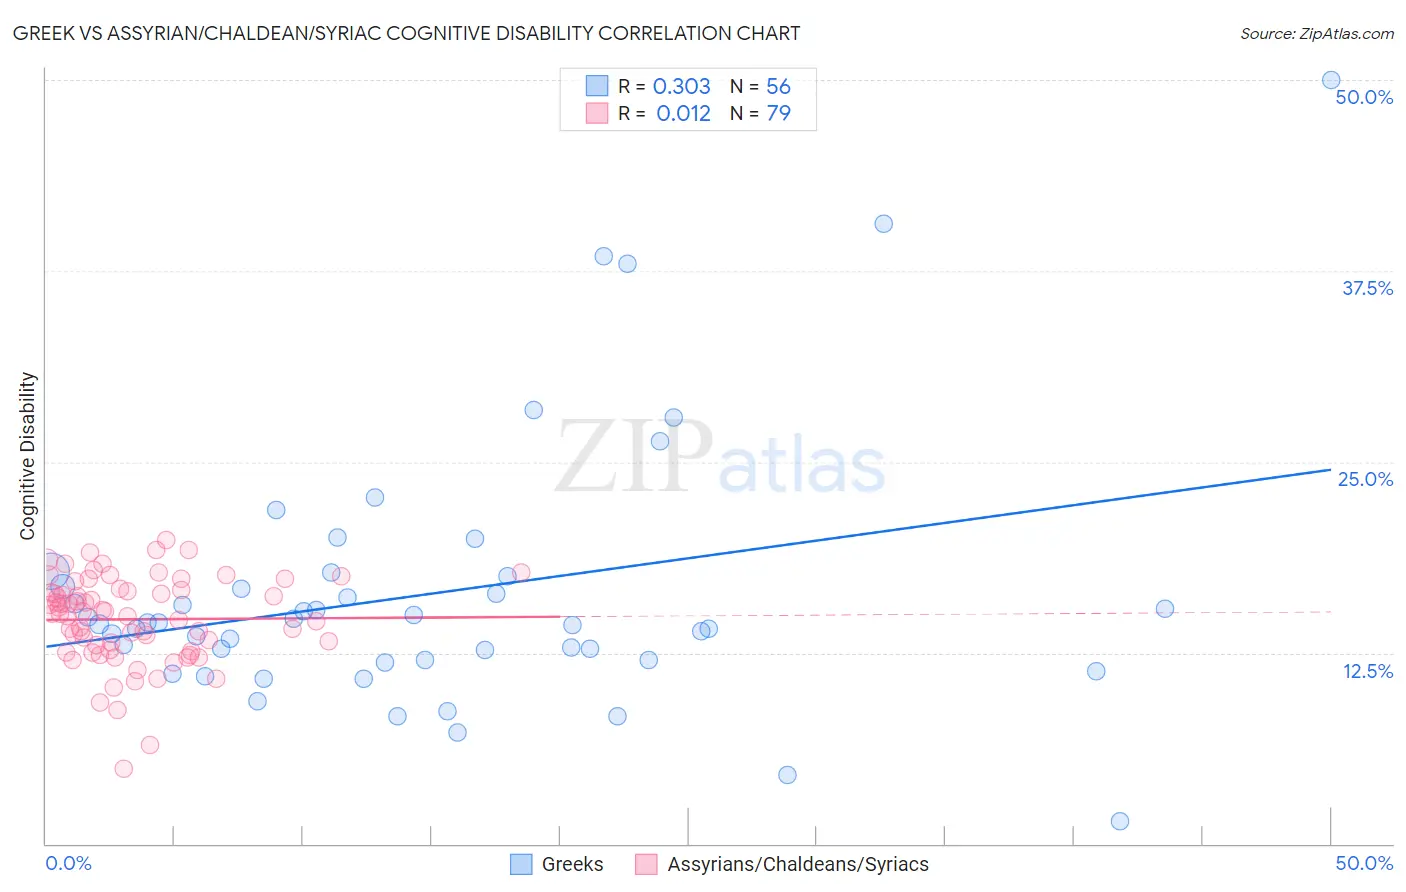
Greek vs Assyrian/Chaldean/Syriac Cognitive Disability Correlation Chart
The statistical analysis conducted on geographies consisting of 482,712,046 people shows a mild positive correlation between the proportion of Greeks and percentage of population with cognitive disability in the United States with a correlation coefficient (R) of 0.303 and weighted average of 16.4%. Similarly, the statistical analysis conducted on geographies consisting of 110,310,504 people shows no correlation between the proportion of Assyrians/Chaldeans/Syriacs and percentage of population with cognitive disability in the United States with a correlation coefficient (R) of 0.012 and weighted average of 16.2%, a difference of 1.5%.
Cognitive Disability Correlation Summary
| Measurement | Greek | Assyrian/Chaldean/Syriac |
| Minimum | 1.5% | 4.9% |
| Maximum | 50.0% | 19.9% |
| Range | 48.5% | 15.0% |
| Mean | 16.4% | 14.7% |
| Median | 14.4% | 15.1% |
| Interquartile 25% (IQ1) | 12.0% | 12.7% |
| Interquartile 75% (IQ3) | 17.2% | 16.6% |
| Interquartile Range (IQR) | 5.2% | 3.9% |
| Standard Deviation (Sample) | 8.7% | 2.9% |
| Standard Deviation (Population) | 8.6% | 2.8% |
Similar Demographics by Cognitive Disability
Demographics Similar to Greeks by Cognitive Disability
In terms of cognitive disability, the demographic groups most similar to Greeks are Slovak (16.4%, a difference of 0.010%), Italian (16.4%, a difference of 0.090%), Russian (16.4%, a difference of 0.090%), Slovene (16.5%, a difference of 0.15%), and Immigrants from Israel (16.4%, a difference of 0.16%).
| Demographics | Rating | Rank | Cognitive Disability |
| Filipinos | 99.9 /100 | #29 | Exceptional 16.4% |
| Czechs | 99.9 /100 | #30 | Exceptional 16.4% |
| Immigrants | Romania | 99.9 /100 | #31 | Exceptional 16.4% |
| Immigrants | Israel | 99.9 /100 | #32 | Exceptional 16.4% |
| Italians | 99.9 /100 | #33 | Exceptional 16.4% |
| Russians | 99.9 /100 | #34 | Exceptional 16.4% |
| Slovaks | 99.9 /100 | #35 | Exceptional 16.4% |
| Greeks | 99.9 /100 | #36 | Exceptional 16.4% |
| Slovenes | 99.9 /100 | #37 | Exceptional 16.5% |
| Immigrants | Eastern Europe | 99.9 /100 | #38 | Exceptional 16.5% |
| Bolivians | 99.9 /100 | #39 | Exceptional 16.5% |
| Immigrants | Belarus | 99.9 /100 | #40 | Exceptional 16.5% |
| Cubans | 99.9 /100 | #41 | Exceptional 16.5% |
| Hungarians | 99.9 /100 | #42 | Exceptional 16.5% |
| Immigrants | Canada | 99.8 /100 | #43 | Exceptional 16.5% |
Demographics Similar to Assyrians/Chaldeans/Syriacs by Cognitive Disability
In terms of cognitive disability, the demographic groups most similar to Assyrians/Chaldeans/Syriacs are Immigrants from Scotland (16.2%, a difference of 0.040%), Immigrants from Czechoslovakia (16.2%, a difference of 0.13%), Maltese (16.2%, a difference of 0.29%), Immigrants from Poland (16.1%, a difference of 0.32%), and Immigrants from Ireland (16.1%, a difference of 0.34%).
| Demographics | Rating | Rank | Cognitive Disability |
| Immigrants | India | 100.0 /100 | #2 | Exceptional 15.9% |
| Chinese | 100.0 /100 | #3 | Exceptional 15.9% |
| Immigrants | Lithuania | 100.0 /100 | #4 | Exceptional 16.0% |
| Immigrants | Hong Kong | 100.0 /100 | #5 | Exceptional 16.0% |
| Thais | 100.0 /100 | #6 | Exceptional 16.1% |
| Immigrants | Ireland | 100.0 /100 | #7 | Exceptional 16.1% |
| Immigrants | Poland | 100.0 /100 | #8 | Exceptional 16.1% |
| Assyrians/Chaldeans/Syriacs | 100.0 /100 | #9 | Exceptional 16.2% |
| Immigrants | Scotland | 100.0 /100 | #10 | Exceptional 16.2% |
| Immigrants | Czechoslovakia | 100.0 /100 | #11 | Exceptional 16.2% |
| Maltese | 100.0 /100 | #12 | Exceptional 16.2% |
| Lithuanians | 100.0 /100 | #13 | Exceptional 16.3% |
| Immigrants | Austria | 100.0 /100 | #14 | Exceptional 16.3% |
| Immigrants | Greece | 100.0 /100 | #15 | Exceptional 16.3% |
| Eastern Europeans | 100.0 /100 | #16 | Exceptional 16.3% |