Creek vs Immigrants from Uganda Cognitive Disability
COMPARE
Creek
Immigrants from Uganda
Cognitive Disability
Cognitive Disability Comparison
Creek
Immigrants from Uganda
18.3%
COGNITIVE DISABILITY
0.0/ 100
METRIC RATING
300th/ 347
METRIC RANK
18.1%
COGNITIVE DISABILITY
0.1/ 100
METRIC RATING
284th/ 347
METRIC RANK
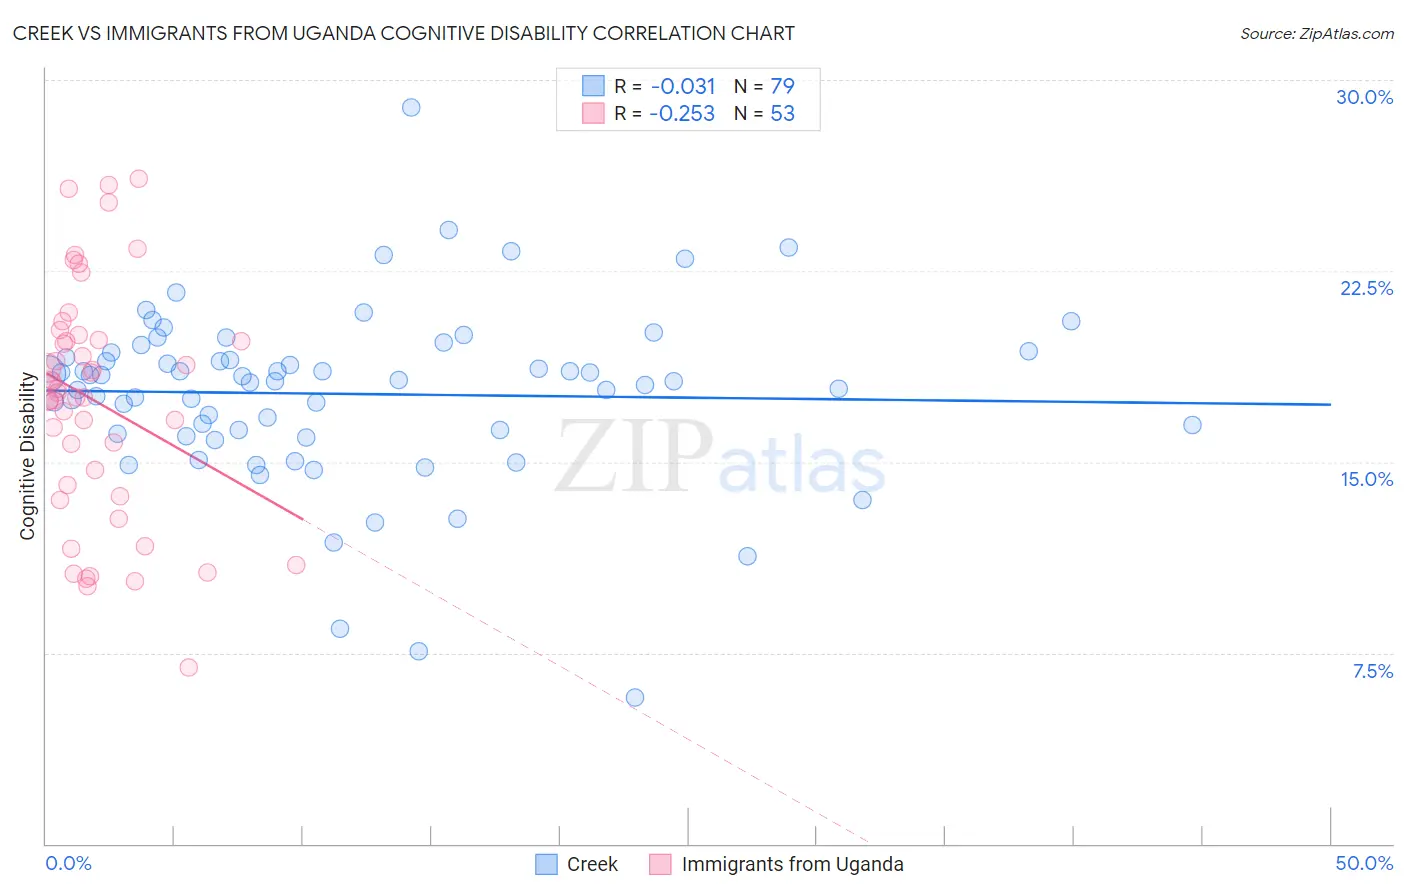
Creek vs Immigrants from Uganda Cognitive Disability Correlation Chart
The statistical analysis conducted on geographies consisting of 178,450,672 people shows no correlation between the proportion of Creek and percentage of population with cognitive disability in the United States with a correlation coefficient (R) of -0.031 and weighted average of 18.3%. Similarly, the statistical analysis conducted on geographies consisting of 125,981,524 people shows a weak negative correlation between the proportion of Immigrants from Uganda and percentage of population with cognitive disability in the United States with a correlation coefficient (R) of -0.253 and weighted average of 18.1%, a difference of 0.82%.
Cognitive Disability Correlation Summary
| Measurement | Creek | Immigrants from Uganda |
| Minimum | 5.7% | 6.9% |
| Maximum | 28.9% | 26.1% |
| Range | 23.2% | 19.2% |
| Mean | 17.7% | 17.4% |
| Median | 18.2% | 17.7% |
| Interquartile 25% (IQ1) | 16.1% | 13.9% |
| Interquartile 75% (IQ3) | 19.3% | 19.9% |
| Interquartile Range (IQR) | 3.2% | 6.0% |
| Standard Deviation (Sample) | 3.5% | 4.6% |
| Standard Deviation (Population) | 3.5% | 4.5% |
Demographics Similar to Creek and Immigrants from Uganda by Cognitive Disability
In terms of cognitive disability, the demographic groups most similar to Creek are Ghanaian (18.3%, a difference of 0.020%), Blackfeet (18.3%, a difference of 0.060%), Japanese (18.3%, a difference of 0.060%), Immigrants from Ghana (18.3%, a difference of 0.14%), and Immigrants from Burma/Myanmar (18.2%, a difference of 0.20%). Similarly, the demographic groups most similar to Immigrants from Uganda are Bermudan (18.1%, a difference of 0.010%), Nigerian (18.1%, a difference of 0.040%), Kenyan (18.1%, a difference of 0.050%), Immigrants from Cambodia (18.1%, a difference of 0.060%), and Dutch West Indian (18.1%, a difference of 0.090%).
| Demographics | Rating | Rank | Cognitive Disability |
| Immigrants | Cambodia | 0.1 /100 | #282 | Tragic 18.1% |
| Nigerians | 0.1 /100 | #283 | Tragic 18.1% |
| Immigrants | Uganda | 0.1 /100 | #284 | Tragic 18.1% |
| Bermudans | 0.1 /100 | #285 | Tragic 18.1% |
| Kenyans | 0.1 /100 | #286 | Tragic 18.1% |
| Dutch West Indians | 0.1 /100 | #287 | Tragic 18.1% |
| Immigrants | West Indies | 0.1 /100 | #288 | Tragic 18.1% |
| Natives/Alaskans | 0.1 /100 | #289 | Tragic 18.1% |
| Immigrants | Africa | 0.1 /100 | #290 | Tragic 18.1% |
| Ottawa | 0.1 /100 | #291 | Tragic 18.2% |
| Iroquois | 0.1 /100 | #292 | Tragic 18.2% |
| Central American Indians | 0.1 /100 | #293 | Tragic 18.2% |
| British West Indians | 0.1 /100 | #294 | Tragic 18.2% |
| German Russians | 0.0 /100 | #295 | Tragic 18.2% |
| Immigrants | Burma/Myanmar | 0.0 /100 | #296 | Tragic 18.2% |
| Blackfeet | 0.0 /100 | #297 | Tragic 18.3% |
| Japanese | 0.0 /100 | #298 | Tragic 18.3% |
| Ghanaians | 0.0 /100 | #299 | Tragic 18.3% |
| Creek | 0.0 /100 | #300 | Tragic 18.3% |
| Immigrants | Ghana | 0.0 /100 | #301 | Tragic 18.3% |
| Barbadians | 0.0 /100 | #302 | Tragic 18.3% |