Serbian vs Immigrants from Uganda Cognitive Disability
COMPARE
Serbian
Immigrants from Uganda
Cognitive Disability
Cognitive Disability Comparison
Serbians
Immigrants from Uganda
16.7%
COGNITIVE DISABILITY
99.1/ 100
METRIC RATING
83rd/ 347
METRIC RANK
18.1%
COGNITIVE DISABILITY
0.1/ 100
METRIC RATING
284th/ 347
METRIC RANK
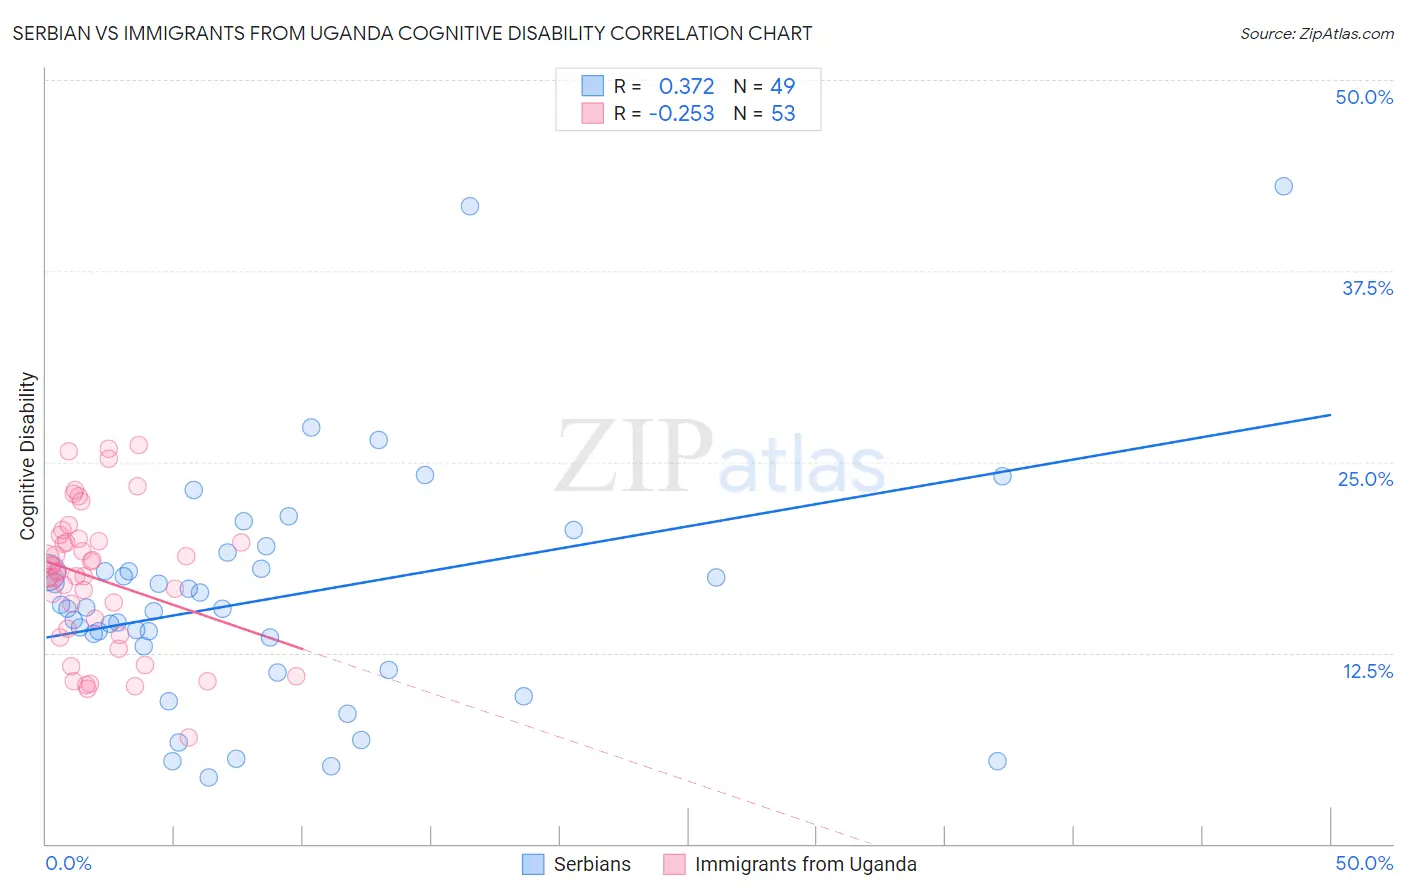
Serbian vs Immigrants from Uganda Cognitive Disability Correlation Chart
The statistical analysis conducted on geographies consisting of 267,644,527 people shows a mild positive correlation between the proportion of Serbians and percentage of population with cognitive disability in the United States with a correlation coefficient (R) of 0.372 and weighted average of 16.7%. Similarly, the statistical analysis conducted on geographies consisting of 125,981,524 people shows a weak negative correlation between the proportion of Immigrants from Uganda and percentage of population with cognitive disability in the United States with a correlation coefficient (R) of -0.253 and weighted average of 18.1%, a difference of 8.5%.
Cognitive Disability Correlation Summary
| Measurement | Serbian | Immigrants from Uganda |
| Minimum | 4.3% | 6.9% |
| Maximum | 43.1% | 26.1% |
| Range | 38.7% | 19.2% |
| Mean | 16.1% | 17.4% |
| Median | 15.4% | 17.7% |
| Interquartile 25% (IQ1) | 12.1% | 13.9% |
| Interquartile 75% (IQ3) | 18.6% | 19.9% |
| Interquartile Range (IQR) | 6.4% | 6.0% |
| Standard Deviation (Sample) | 7.8% | 4.6% |
| Standard Deviation (Population) | 7.7% | 4.5% |
Similar Demographics by Cognitive Disability
Demographics Similar to Serbians by Cognitive Disability
In terms of cognitive disability, the demographic groups most similar to Serbians are Belgian (16.7%, a difference of 0.020%), Immigrants from Moldova (16.7%, a difference of 0.030%), Swiss (16.7%, a difference of 0.070%), Immigrants from South Africa (16.7%, a difference of 0.070%), and Native Hawaiian (16.7%, a difference of 0.080%).
| Demographics | Rating | Rank | Cognitive Disability |
| Immigrants | Serbia | 99.3 /100 | #76 | Exceptional 16.7% |
| Immigrants | Hungary | 99.3 /100 | #77 | Exceptional 16.7% |
| Peruvians | 99.3 /100 | #78 | Exceptional 16.7% |
| Immigrants | Bulgaria | 99.3 /100 | #79 | Exceptional 16.7% |
| Egyptians | 99.2 /100 | #80 | Exceptional 16.7% |
| Immigrants | Netherlands | 99.2 /100 | #81 | Exceptional 16.7% |
| Swiss | 99.2 /100 | #82 | Exceptional 16.7% |
| Serbians | 99.1 /100 | #83 | Exceptional 16.7% |
| Belgians | 99.1 /100 | #84 | Exceptional 16.7% |
| Immigrants | Moldova | 99.1 /100 | #85 | Exceptional 16.7% |
| Immigrants | South Africa | 99.0 /100 | #86 | Exceptional 16.7% |
| Native Hawaiians | 99.0 /100 | #87 | Exceptional 16.7% |
| Immigrants | Philippines | 99.0 /100 | #88 | Exceptional 16.7% |
| Immigrants | Egypt | 98.8 /100 | #89 | Exceptional 16.7% |
| South Americans | 98.8 /100 | #90 | Exceptional 16.7% |
Demographics Similar to Immigrants from Uganda by Cognitive Disability
In terms of cognitive disability, the demographic groups most similar to Immigrants from Uganda are Bermudan (18.1%, a difference of 0.010%), Nigerian (18.1%, a difference of 0.040%), Kenyan (18.1%, a difference of 0.050%), Immigrants from Cambodia (18.1%, a difference of 0.060%), and Yakama (18.1%, a difference of 0.090%).
| Demographics | Rating | Rank | Cognitive Disability |
| Immigrants | Kuwait | 0.2 /100 | #277 | Tragic 18.1% |
| Immigrants | Micronesia | 0.2 /100 | #278 | Tragic 18.1% |
| Chippewa | 0.1 /100 | #279 | Tragic 18.1% |
| West Indians | 0.1 /100 | #280 | Tragic 18.1% |
| Yakama | 0.1 /100 | #281 | Tragic 18.1% |
| Immigrants | Cambodia | 0.1 /100 | #282 | Tragic 18.1% |
| Nigerians | 0.1 /100 | #283 | Tragic 18.1% |
| Immigrants | Uganda | 0.1 /100 | #284 | Tragic 18.1% |
| Bermudans | 0.1 /100 | #285 | Tragic 18.1% |
| Kenyans | 0.1 /100 | #286 | Tragic 18.1% |
| Dutch West Indians | 0.1 /100 | #287 | Tragic 18.1% |
| Immigrants | West Indies | 0.1 /100 | #288 | Tragic 18.1% |
| Natives/Alaskans | 0.1 /100 | #289 | Tragic 18.1% |
| Immigrants | Africa | 0.1 /100 | #290 | Tragic 18.1% |
| Ottawa | 0.1 /100 | #291 | Tragic 18.2% |