Israeli vs Immigrants from Uganda Cognitive Disability
COMPARE
Israeli
Immigrants from Uganda
Cognitive Disability
Cognitive Disability Comparison
Israelis
Immigrants from Uganda
17.0%
COGNITIVE DISABILITY
91.0/ 100
METRIC RATING
136th/ 347
METRIC RANK
18.1%
COGNITIVE DISABILITY
0.1/ 100
METRIC RATING
284th/ 347
METRIC RANK
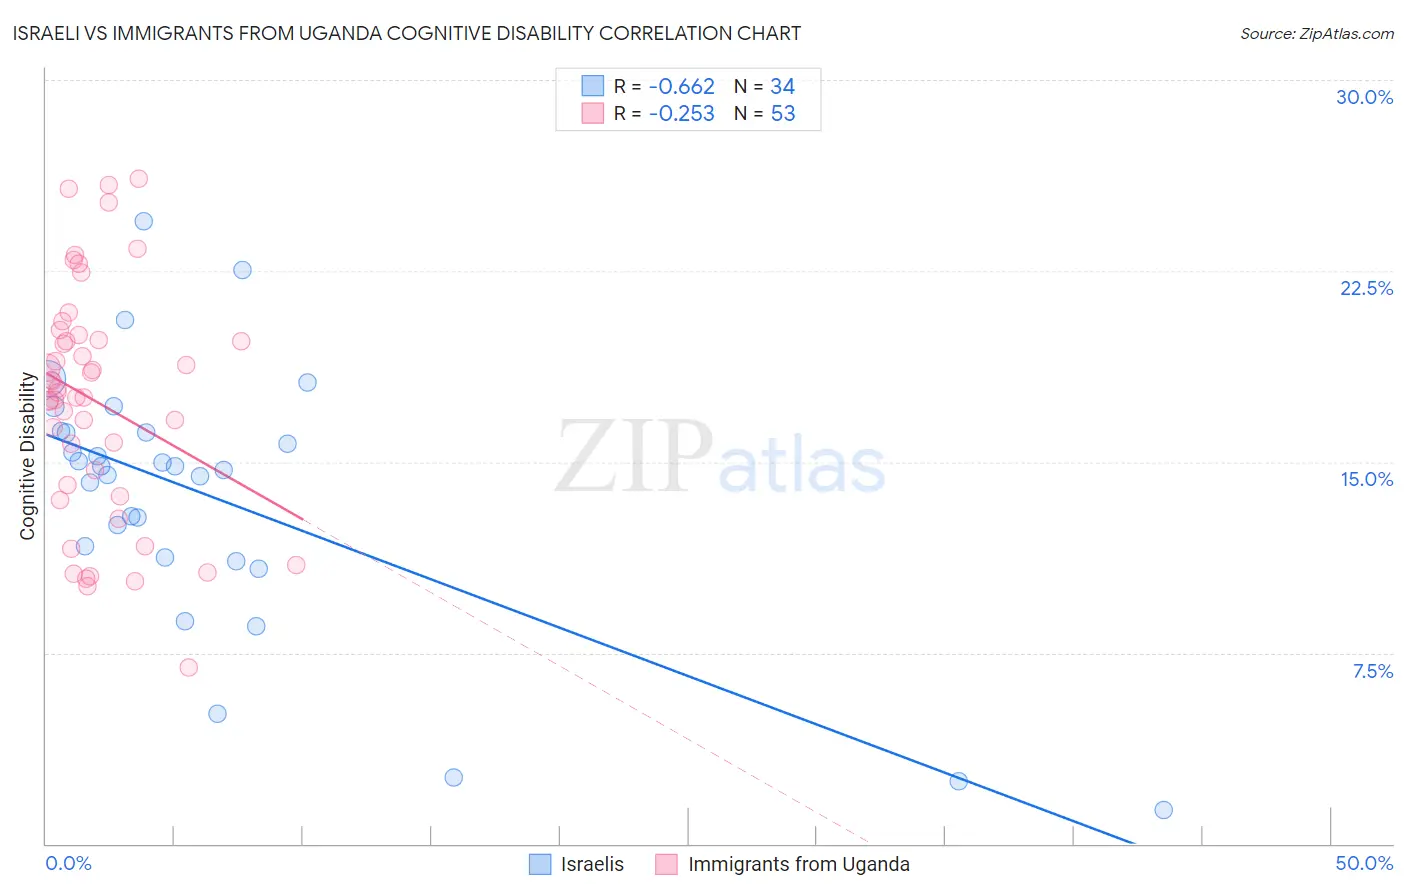
Israeli vs Immigrants from Uganda Cognitive Disability Correlation Chart
The statistical analysis conducted on geographies consisting of 211,174,000 people shows a significant negative correlation between the proportion of Israelis and percentage of population with cognitive disability in the United States with a correlation coefficient (R) of -0.662 and weighted average of 17.0%. Similarly, the statistical analysis conducted on geographies consisting of 125,981,524 people shows a weak negative correlation between the proportion of Immigrants from Uganda and percentage of population with cognitive disability in the United States with a correlation coefficient (R) of -0.253 and weighted average of 18.1%, a difference of 6.6%.
Cognitive Disability Correlation Summary
| Measurement | Israeli | Immigrants from Uganda |
| Minimum | 1.3% | 6.9% |
| Maximum | 24.5% | 26.1% |
| Range | 23.1% | 19.2% |
| Mean | 13.6% | 17.4% |
| Median | 14.7% | 17.7% |
| Interquartile 25% (IQ1) | 11.3% | 13.9% |
| Interquartile 75% (IQ3) | 16.2% | 19.9% |
| Interquartile Range (IQR) | 4.9% | 6.0% |
| Standard Deviation (Sample) | 5.2% | 4.6% |
| Standard Deviation (Population) | 5.1% | 4.5% |
Similar Demographics by Cognitive Disability
Demographics Similar to Israelis by Cognitive Disability
In terms of cognitive disability, the demographic groups most similar to Israelis are Immigrants from Norway (17.0%, a difference of 0.0%), Welsh (17.0%, a difference of 0.020%), Lebanese (17.0%, a difference of 0.030%), Immigrants from Chile (17.0%, a difference of 0.060%), and Immigrants from Jordan (17.0%, a difference of 0.080%).
| Demographics | Rating | Rank | Cognitive Disability |
| Immigrants | Uruguay | 92.9 /100 | #129 | Exceptional 17.0% |
| Immigrants | Vietnam | 92.4 /100 | #130 | Exceptional 17.0% |
| Immigrants | Germany | 92.1 /100 | #131 | Exceptional 17.0% |
| Whites/Caucasians | 92.1 /100 | #132 | Exceptional 17.0% |
| Immigrants | Jordan | 91.9 /100 | #133 | Exceptional 17.0% |
| Immigrants | Chile | 91.7 /100 | #134 | Exceptional 17.0% |
| Lebanese | 91.3 /100 | #135 | Exceptional 17.0% |
| Israelis | 91.0 /100 | #136 | Exceptional 17.0% |
| Immigrants | Norway | 90.9 /100 | #137 | Exceptional 17.0% |
| Welsh | 90.8 /100 | #138 | Exceptional 17.0% |
| French | 90.0 /100 | #139 | Excellent 17.0% |
| Chileans | 89.9 /100 | #140 | Excellent 17.0% |
| Aleuts | 89.9 /100 | #141 | Excellent 17.0% |
| Carpatho Rusyns | 89.6 /100 | #142 | Excellent 17.0% |
| British | 89.3 /100 | #143 | Excellent 17.0% |
Demographics Similar to Immigrants from Uganda by Cognitive Disability
In terms of cognitive disability, the demographic groups most similar to Immigrants from Uganda are Bermudan (18.1%, a difference of 0.010%), Nigerian (18.1%, a difference of 0.040%), Kenyan (18.1%, a difference of 0.050%), Immigrants from Cambodia (18.1%, a difference of 0.060%), and Yakama (18.1%, a difference of 0.090%).
| Demographics | Rating | Rank | Cognitive Disability |
| Immigrants | Kuwait | 0.2 /100 | #277 | Tragic 18.1% |
| Immigrants | Micronesia | 0.2 /100 | #278 | Tragic 18.1% |
| Chippewa | 0.1 /100 | #279 | Tragic 18.1% |
| West Indians | 0.1 /100 | #280 | Tragic 18.1% |
| Yakama | 0.1 /100 | #281 | Tragic 18.1% |
| Immigrants | Cambodia | 0.1 /100 | #282 | Tragic 18.1% |
| Nigerians | 0.1 /100 | #283 | Tragic 18.1% |
| Immigrants | Uganda | 0.1 /100 | #284 | Tragic 18.1% |
| Bermudans | 0.1 /100 | #285 | Tragic 18.1% |
| Kenyans | 0.1 /100 | #286 | Tragic 18.1% |
| Dutch West Indians | 0.1 /100 | #287 | Tragic 18.1% |
| Immigrants | West Indies | 0.1 /100 | #288 | Tragic 18.1% |
| Natives/Alaskans | 0.1 /100 | #289 | Tragic 18.1% |
| Immigrants | Africa | 0.1 /100 | #290 | Tragic 18.1% |
| Ottawa | 0.1 /100 | #291 | Tragic 18.2% |