Sudanese vs Immigrants from Uganda Cognitive Disability
COMPARE
Sudanese
Immigrants from Uganda
Cognitive Disability
Cognitive Disability Comparison
Sudanese
Immigrants from Uganda
18.9%
COGNITIVE DISABILITY
0.0/ 100
METRIC RATING
334th/ 347
METRIC RANK
18.1%
COGNITIVE DISABILITY
0.1/ 100
METRIC RATING
284th/ 347
METRIC RANK
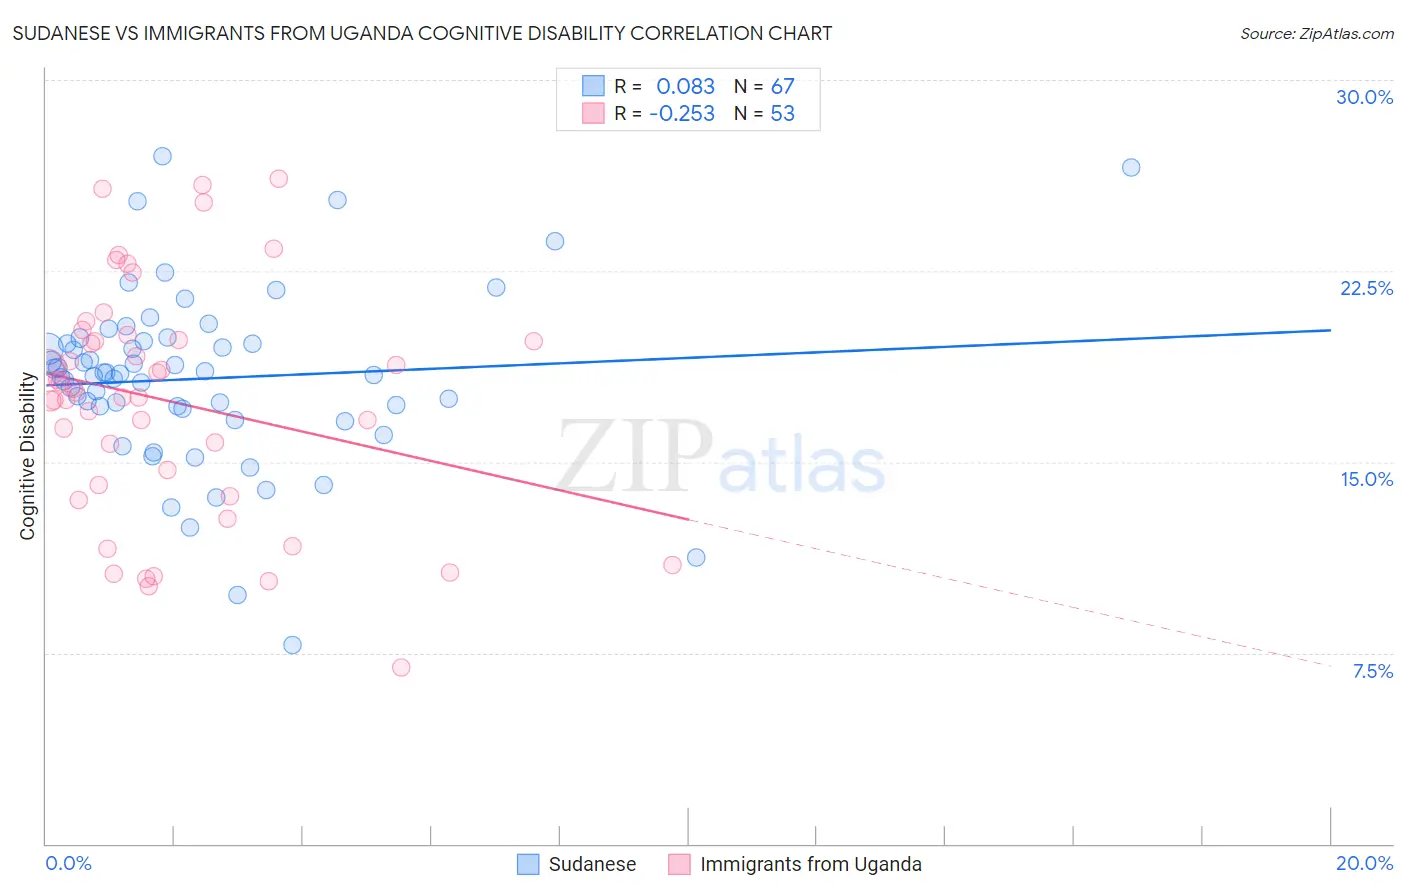
Sudanese vs Immigrants from Uganda Cognitive Disability Correlation Chart
The statistical analysis conducted on geographies consisting of 110,121,585 people shows a slight positive correlation between the proportion of Sudanese and percentage of population with cognitive disability in the United States with a correlation coefficient (R) of 0.083 and weighted average of 18.9%. Similarly, the statistical analysis conducted on geographies consisting of 125,981,524 people shows a weak negative correlation between the proportion of Immigrants from Uganda and percentage of population with cognitive disability in the United States with a correlation coefficient (R) of -0.253 and weighted average of 18.1%, a difference of 4.2%.
Cognitive Disability Correlation Summary
| Measurement | Sudanese | Immigrants from Uganda |
| Minimum | 7.8% | 6.9% |
| Maximum | 27.0% | 26.1% |
| Range | 19.2% | 19.2% |
| Mean | 18.3% | 17.4% |
| Median | 18.4% | 17.7% |
| Interquartile 25% (IQ1) | 17.1% | 13.9% |
| Interquartile 75% (IQ3) | 19.7% | 19.9% |
| Interquartile Range (IQR) | 2.7% | 6.0% |
| Standard Deviation (Sample) | 3.5% | 4.6% |
| Standard Deviation (Population) | 3.4% | 4.5% |
Similar Demographics by Cognitive Disability
Demographics Similar to Sudanese by Cognitive Disability
In terms of cognitive disability, the demographic groups most similar to Sudanese are Immigrants from Yemen (18.8%, a difference of 0.38%), Immigrants from Sudan (18.8%, a difference of 0.44%), Pima (18.8%, a difference of 0.45%), Immigrants from Dominican Republic (18.8%, a difference of 0.52%), and Senegalese (19.0%, a difference of 0.54%).
| Demographics | Rating | Rank | Cognitive Disability |
| U.S. Virgin Islanders | 0.0 /100 | #327 | Tragic 18.7% |
| Kiowa | 0.0 /100 | #328 | Tragic 18.7% |
| Navajo | 0.0 /100 | #329 | Tragic 18.8% |
| Immigrants | Dominican Republic | 0.0 /100 | #330 | Tragic 18.8% |
| Pima | 0.0 /100 | #331 | Tragic 18.8% |
| Immigrants | Sudan | 0.0 /100 | #332 | Tragic 18.8% |
| Immigrants | Yemen | 0.0 /100 | #333 | Tragic 18.8% |
| Sudanese | 0.0 /100 | #334 | Tragic 18.9% |
| Senegalese | 0.0 /100 | #335 | Tragic 19.0% |
| Blacks/African Americans | 0.0 /100 | #336 | Tragic 19.0% |
| Immigrants | Saudi Arabia | 0.0 /100 | #337 | Tragic 19.1% |
| Lumbee | 0.0 /100 | #338 | Tragic 19.1% |
| Puerto Ricans | 0.0 /100 | #339 | Tragic 19.2% |
| Cape Verdeans | 0.0 /100 | #340 | Tragic 19.2% |
| Tohono O'odham | 0.0 /100 | #341 | Tragic 19.3% |
Demographics Similar to Immigrants from Uganda by Cognitive Disability
In terms of cognitive disability, the demographic groups most similar to Immigrants from Uganda are Bermudan (18.1%, a difference of 0.010%), Nigerian (18.1%, a difference of 0.040%), Kenyan (18.1%, a difference of 0.050%), Immigrants from Cambodia (18.1%, a difference of 0.060%), and Yakama (18.1%, a difference of 0.090%).
| Demographics | Rating | Rank | Cognitive Disability |
| Immigrants | Kuwait | 0.2 /100 | #277 | Tragic 18.1% |
| Immigrants | Micronesia | 0.2 /100 | #278 | Tragic 18.1% |
| Chippewa | 0.1 /100 | #279 | Tragic 18.1% |
| West Indians | 0.1 /100 | #280 | Tragic 18.1% |
| Yakama | 0.1 /100 | #281 | Tragic 18.1% |
| Immigrants | Cambodia | 0.1 /100 | #282 | Tragic 18.1% |
| Nigerians | 0.1 /100 | #283 | Tragic 18.1% |
| Immigrants | Uganda | 0.1 /100 | #284 | Tragic 18.1% |
| Bermudans | 0.1 /100 | #285 | Tragic 18.1% |
| Kenyans | 0.1 /100 | #286 | Tragic 18.1% |
| Dutch West Indians | 0.1 /100 | #287 | Tragic 18.1% |
| Immigrants | West Indies | 0.1 /100 | #288 | Tragic 18.1% |
| Natives/Alaskans | 0.1 /100 | #289 | Tragic 18.1% |
| Immigrants | Africa | 0.1 /100 | #290 | Tragic 18.1% |
| Ottawa | 0.1 /100 | #291 | Tragic 18.2% |