Ghanaian vs Immigrants from Uzbekistan Disability Age Under 5
COMPARE
Ghanaian
Immigrants from Uzbekistan
Disability Age Under 5
Disability Age Under 5 Comparison
Ghanaians
Immigrants from Uzbekistan
1.2%
DISABILITY AGE UNDER 5
76.3/ 100
METRIC RATING
148th/ 347
METRIC RANK
0.85%
DISABILITY AGE UNDER 5
100.0/ 100
METRIC RATING
4th/ 347
METRIC RANK
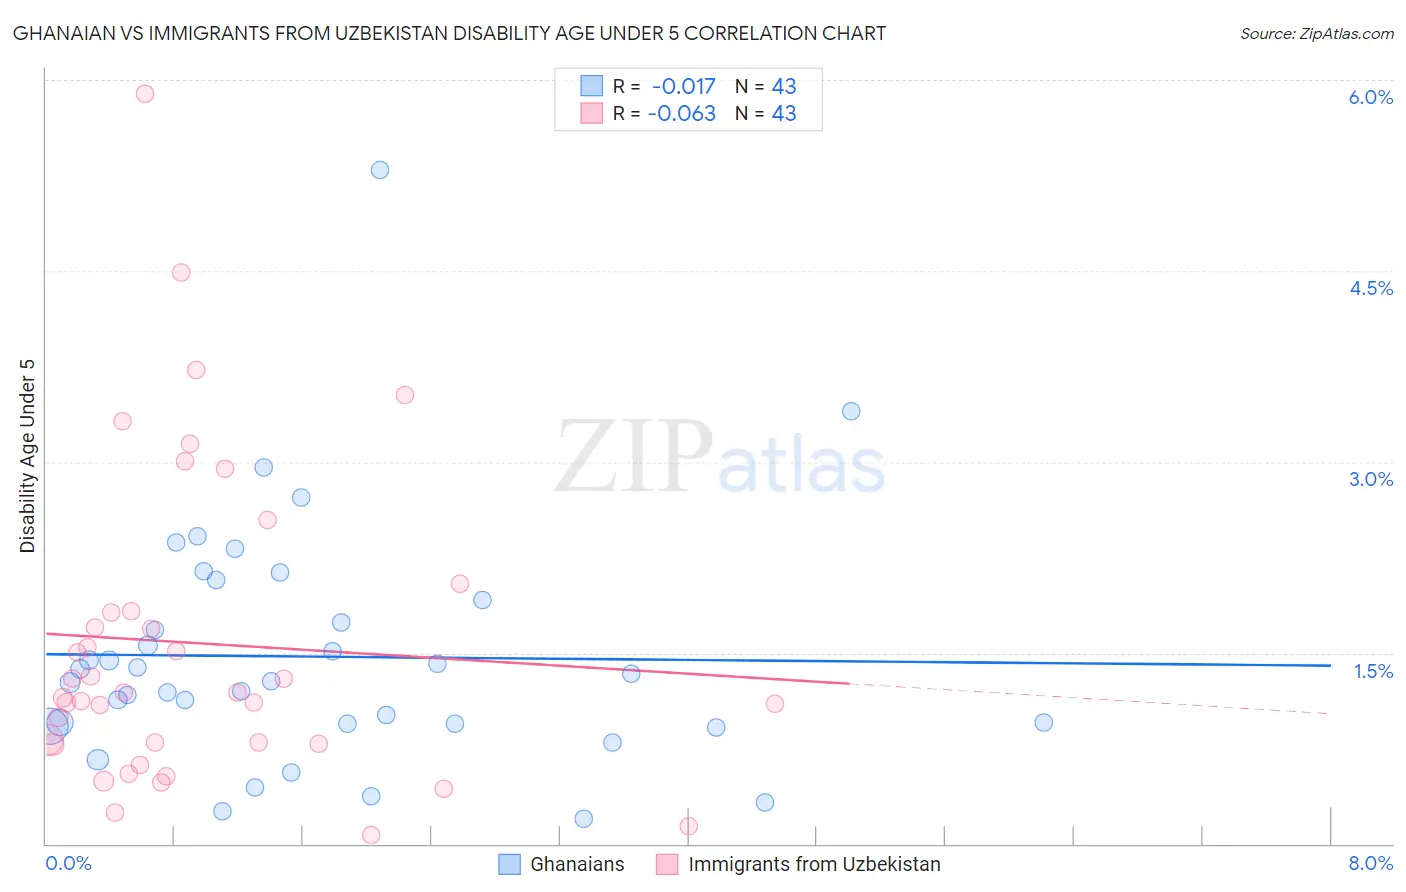
Ghanaian vs Immigrants from Uzbekistan Disability Age Under 5 Correlation Chart
The statistical analysis conducted on geographies consisting of 127,583,107 people shows no correlation between the proportion of Ghanaians and percentage of population with a disability under the age of 5 in the United States with a correlation coefficient (R) of -0.017 and weighted average of 1.2%. Similarly, the statistical analysis conducted on geographies consisting of 86,983,125 people shows a slight negative correlation between the proportion of Immigrants from Uzbekistan and percentage of population with a disability under the age of 5 in the United States with a correlation coefficient (R) of -0.063 and weighted average of 0.85%, a difference of 42.1%.
Disability Age Under 5 Correlation Summary
| Measurement | Ghanaian | Immigrants from Uzbekistan |
| Minimum | 0.20% | 0.069% |
| Maximum | 5.3% | 5.9% |
| Range | 5.1% | 5.8% |
| Mean | 1.5% | 1.6% |
| Median | 1.3% | 1.2% |
| Interquartile 25% (IQ1) | 0.94% | 0.79% |
| Interquartile 75% (IQ3) | 1.9% | 1.8% |
| Interquartile Range (IQR) | 0.97% | 1.0% |
| Standard Deviation (Sample) | 0.94% | 1.2% |
| Standard Deviation (Population) | 0.93% | 1.2% |
Similar Demographics by Disability Age Under 5
Demographics Similar to Ghanaians by Disability Age Under 5
In terms of disability age under 5, the demographic groups most similar to Ghanaians are Icelander (1.2%, a difference of 0.010%), Kenyan (1.2%, a difference of 0.050%), South American (1.2%, a difference of 0.090%), Samoan (1.2%, a difference of 0.19%), and Yaqui (1.2%, a difference of 0.19%).
| Demographics | Rating | Rank | Disability Age Under 5 |
| Immigrants | Honduras | 80.4 /100 | #141 | Excellent 1.2% |
| Immigrants | Colombia | 79.3 /100 | #142 | Good 1.2% |
| Alsatians | 79.3 /100 | #143 | Good 1.2% |
| Immigrants | Middle Africa | 79.3 /100 | #144 | Good 1.2% |
| Immigrants | Zimbabwe | 77.9 /100 | #145 | Good 1.2% |
| Samoans | 77.7 /100 | #146 | Good 1.2% |
| Icelanders | 76.3 /100 | #147 | Good 1.2% |
| Ghanaians | 76.3 /100 | #148 | Good 1.2% |
| Kenyans | 75.9 /100 | #149 | Good 1.2% |
| South Americans | 75.6 /100 | #150 | Good 1.2% |
| Yaqui | 74.8 /100 | #151 | Good 1.2% |
| Hondurans | 72.5 /100 | #152 | Good 1.2% |
| Immigrants | Thailand | 69.4 /100 | #153 | Good 1.2% |
| Uruguayans | 68.8 /100 | #154 | Good 1.2% |
| Immigrants | Ghana | 68.7 /100 | #155 | Good 1.2% |
Demographics Similar to Immigrants from Uzbekistan by Disability Age Under 5
In terms of disability age under 5, the demographic groups most similar to Immigrants from Uzbekistan are Immigrants from Bangladesh (0.85%, a difference of 0.41%), Ute (0.86%, a difference of 1.3%), Vietnamese (0.81%, a difference of 4.6%), Immigrants from Afghanistan (0.91%, a difference of 6.7%), and Immigrants from Yemen (0.91%, a difference of 6.9%).
| Demographics | Rating | Rank | Disability Age Under 5 |
| Immigrants | Armenia | 100.0 /100 | #1 | Exceptional 0.76% |
| Immigrants | St. Vincent and the Grenadines | 100.0 /100 | #2 | Exceptional 0.79% |
| Vietnamese | 100.0 /100 | #3 | Exceptional 0.81% |
| Immigrants | Uzbekistan | 100.0 /100 | #4 | Exceptional 0.85% |
| Immigrants | Bangladesh | 100.0 /100 | #5 | Exceptional 0.85% |
| Ute | 100.0 /100 | #6 | Exceptional 0.86% |
| Immigrants | Afghanistan | 100.0 /100 | #7 | Exceptional 0.91% |
| Immigrants | Yemen | 100.0 /100 | #8 | Exceptional 0.91% |
| Immigrants | Fiji | 100.0 /100 | #9 | Exceptional 0.92% |
| Marshallese | 100.0 /100 | #10 | Exceptional 0.94% |
| Afghans | 100.0 /100 | #11 | Exceptional 0.94% |
| Immigrants | Grenada | 100.0 /100 | #12 | Exceptional 0.94% |
| Soviet Union | 100.0 /100 | #13 | Exceptional 0.95% |
| Yuman | 100.0 /100 | #14 | Exceptional 0.95% |
| Immigrants | Hong Kong | 100.0 /100 | #15 | Exceptional 0.95% |