Immigrants from Sudan vs Maltese Disability Age 5 to 17
COMPARE
Immigrants from Sudan
Maltese
Disability Age 5 to 17
Disability Age 5 to 17 Comparison
Immigrants from Sudan
Maltese
5.8%
DISABILITY AGE 5 TO 17
6.7/ 100
METRIC RATING
222nd/ 347
METRIC RANK
5.4%
DISABILITY AGE 5 TO 17
96.0/ 100
METRIC RATING
121st/ 347
METRIC RANK
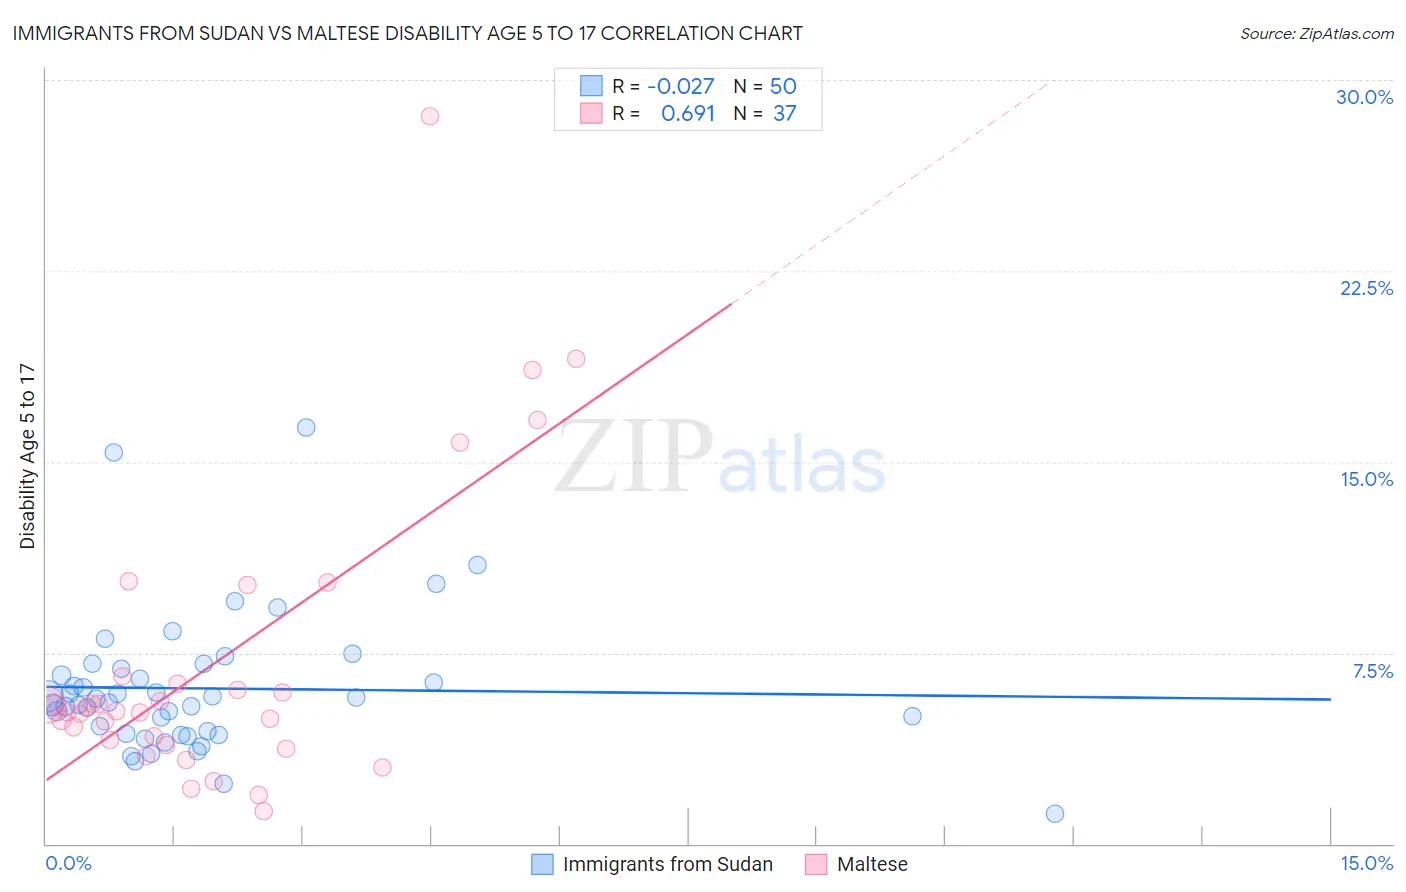
Immigrants from Sudan vs Maltese Disability Age 5 to 17 Correlation Chart
The statistical analysis conducted on geographies consisting of 118,823,515 people shows no correlation between the proportion of Immigrants from Sudan and percentage of population with a disability between the ages 5 and 17 in the United States with a correlation coefficient (R) of -0.027 and weighted average of 5.8%. Similarly, the statistical analysis conducted on geographies consisting of 125,822,191 people shows a significant positive correlation between the proportion of Maltese and percentage of population with a disability between the ages 5 and 17 in the United States with a correlation coefficient (R) of 0.691 and weighted average of 5.4%, a difference of 7.5%.
Disability Age 5 to 17 Correlation Summary
| Measurement | Immigrants from Sudan | Maltese |
| Minimum | 1.2% | 1.3% |
| Maximum | 16.4% | 28.6% |
| Range | 15.2% | 27.3% |
| Mean | 6.1% | 7.0% |
| Median | 5.6% | 5.2% |
| Interquartile 25% (IQ1) | 4.3% | 4.0% |
| Interquartile 75% (IQ3) | 6.9% | 6.4% |
| Interquartile Range (IQR) | 2.6% | 2.5% |
| Standard Deviation (Sample) | 2.8% | 5.7% |
| Standard Deviation (Population) | 2.7% | 5.6% |
Similar Demographics by Disability Age 5 to 17
Demographics Similar to Immigrants from Sudan by Disability Age 5 to 17
In terms of disability age 5 to 17, the demographic groups most similar to Immigrants from Sudan are Lithuanian (5.8%, a difference of 0.0%), Belgian (5.8%, a difference of 0.040%), Sierra Leonean (5.8%, a difference of 0.060%), Immigrants from Sierra Leone (5.8%, a difference of 0.070%), and Czech (5.8%, a difference of 0.12%).
| Demographics | Rating | Rank | Disability Age 5 to 17 |
| Swedes | 8.1 /100 | #215 | Tragic 5.8% |
| Nigerians | 7.5 /100 | #216 | Tragic 5.8% |
| Czechs | 7.4 /100 | #217 | Tragic 5.8% |
| Immigrants | Sierra Leone | 7.1 /100 | #218 | Tragic 5.8% |
| Sierra Leoneans | 7.0 /100 | #219 | Tragic 5.8% |
| Belgians | 6.9 /100 | #220 | Tragic 5.8% |
| Lithuanians | 6.7 /100 | #221 | Tragic 5.8% |
| Immigrants | Sudan | 6.7 /100 | #222 | Tragic 5.8% |
| Alsatians | 6.0 /100 | #223 | Tragic 5.8% |
| Mexicans | 5.7 /100 | #224 | Tragic 5.8% |
| Guamanians/Chamorros | 5.6 /100 | #225 | Tragic 5.8% |
| British West Indians | 5.4 /100 | #226 | Tragic 5.8% |
| Swiss | 5.1 /100 | #227 | Tragic 5.8% |
| Haitians | 4.8 /100 | #228 | Tragic 5.8% |
| Bangladeshis | 4.8 /100 | #229 | Tragic 5.8% |
Demographics Similar to Maltese by Disability Age 5 to 17
In terms of disability age 5 to 17, the demographic groups most similar to Maltese are Chilean (5.4%, a difference of 0.060%), Immigrants from Ethiopia (5.4%, a difference of 0.16%), Crow (5.4%, a difference of 0.29%), Immigrants from Chile (5.4%, a difference of 0.30%), and New Zealander (5.4%, a difference of 0.31%).
| Demographics | Rating | Rank | Disability Age 5 to 17 |
| Immigrants | Northern Europe | 97.8 /100 | #114 | Exceptional 5.3% |
| Cubans | 97.8 /100 | #115 | Exceptional 5.3% |
| Cypriots | 97.7 /100 | #116 | Exceptional 5.3% |
| Immigrants | Afghanistan | 97.4 /100 | #117 | Exceptional 5.3% |
| South Americans | 97.1 /100 | #118 | Exceptional 5.4% |
| Immigrants | South America | 97.1 /100 | #119 | Exceptional 5.4% |
| Immigrants | Immigrants | 97.0 /100 | #120 | Exceptional 5.4% |
| Maltese | 96.0 /100 | #121 | Exceptional 5.4% |
| Chileans | 95.8 /100 | #122 | Exceptional 5.4% |
| Immigrants | Ethiopia | 95.5 /100 | #123 | Exceptional 5.4% |
| Crow | 95.0 /100 | #124 | Exceptional 5.4% |
| Immigrants | Chile | 95.0 /100 | #125 | Exceptional 5.4% |
| New Zealanders | 95.0 /100 | #126 | Exceptional 5.4% |
| Latvians | 95.0 /100 | #127 | Exceptional 5.4% |
| Immigrants | Venezuela | 94.5 /100 | #128 | Exceptional 5.4% |